Critical Issues in Climate Change Science
The collection 'Critical Issues in Climate Change Science' synthesises emerging peer-reviewed evidence on a range of climate change impacts and understanding, using evidence gathered at ScienceBrief.org.
A collection of ScienceBrief Reviews synthesising the latest research on climate change impacts, understanding and future developments.
This collection brings ScienceBrief Reviews together in one volume covering the impacts of climate change on wildfires, cyclones, extreme rainfall, marine heatwaves, Arctic amplification, carbon sinks and the role of independent expert advisory bodies. The evidence discussed in these reviews was collected at ScienceBrief.org and can be explored via links within each review.
The collection is available as a pdf to download or print here.
Contents
- Introduction
- Methodology
- Wildfires (Jan 2020)
- Wildfires (Sep 2020 update)
- Tropical Cyclones
- Extreme rainfall
- Marine heatwaves
- Arctic amplification
- Carbon sinks and feedbacks
- Independent expert advisory bodies
- Acknowledgments
1. Introduction
At a time when society needs to tackle critical issues like climate change and biodiversity loss, sound and accessible scientific evidence is critical. ScienceBrief provides timely answers to arising questions on the state of science. It helps counter proliferating false news by making information widely available when it is needed.
ScienceBrief.org is a platform to keep up with science and the 'Critical Issues in Climate Change Science' topic is focussed on emerging peer-reviewed literature on the impacts of climate change and the understanding of scientists around the world.
The collection highlights consequences of failing to tackle climate change.
ScienceBrief Reviews are written to synthesise the peer-reviewed evidence published in recent years on specific themes. They give an accessible overview of many impacts of climate change and highlight these already devastating and predicted worsening future impacts. The collection reinforces the urgent need for global action to reduce the impact of climate change, as evidence shows the most severe impacts can be avoided by rapidly and substantially reducing greenhouse gas emissions.

2. Methodology
A number of statements were drafted by an Advisory Board of senior scientists to describe the latest understanding on each subject. Peer-reviewed evidence is gathered and uploaded to the relevant ScienceBrief page and is marked as supporting, informing or refuting the statement, based on the findings within the evidence. The consensus score for the statement is calculated based on the number of papers assigned to each of those categories.
Key word searches are used to identify evidence for each ScienceBrief, with papers published since the 5th Assessment Report of the Intergovernmental Panel on Climate Change (IPCC AR5, March 2013) included.
Once the evidence is gathered, experts in each topic write a ScienceBrief Review to synthesise the latest understanding. Prior to publication each draft undergoes independent review by an expert and the ScienceBrief Editorial Board.
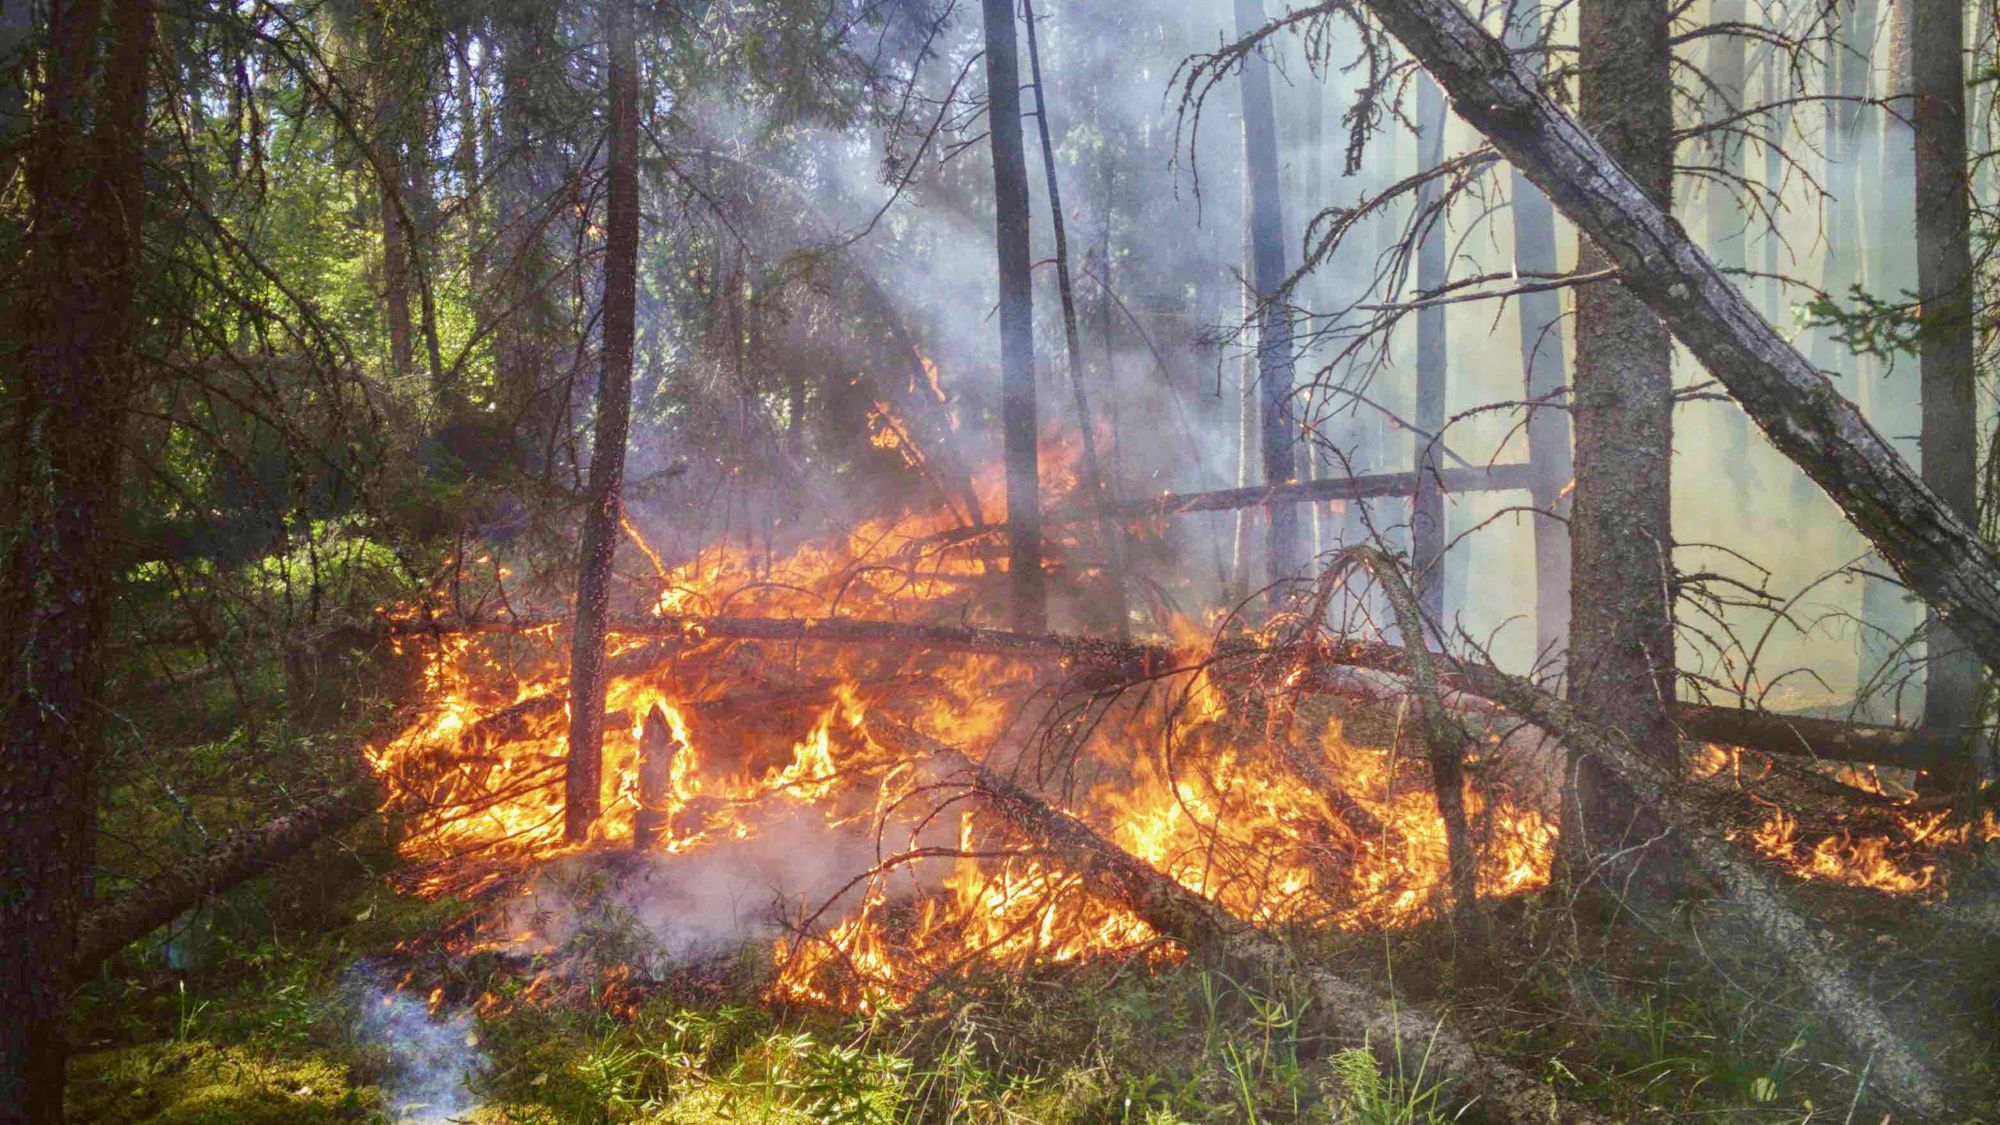
3. Climate change increases the risk of wildfires
January 2020 Review
- Tyndall Centre for Climate Change Research, School of Environmental Sciences, University of East Anglia (UEA), UK.
- Met Office Hadley Centre, Exeter, UK. College of Life and Environmental Sciences, University of Exeter, UK.
- CSIRO Oceans and Atmosphere, G.P.O. Box 1700, Canberra, ACT 2601, Australia.
- Department of Life Sciences and Leverhulme Centre for Wildfires, Environment and Society, Imperial College, London, UK.
Full version in pdf format is available here.
This ScienceBrief Review is part of a collection on Critical Issues in Climate Change Science, prepared for the COP26 climate conference in Glasgow (2021). Eds: Corinne Le Quéré, Peter Liss, Piers Forster.
Approach. This ScienceBrief Review examines the evidence linking climate change and wildfire risk. It synthesises 57 peer-reviewed articles gathered using ScienceBrief. The Brief and evidence can be explored at: https://sciencebrief.org/topics/climate-change-science/wildfires.
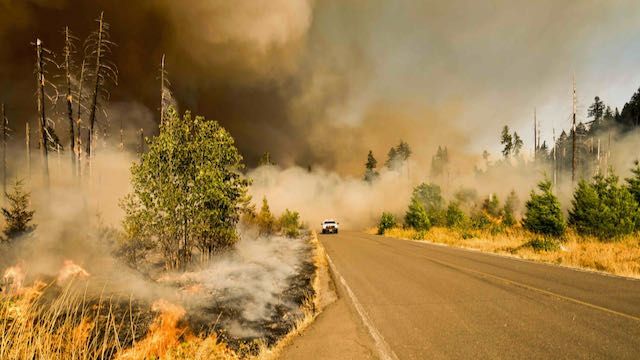
Summary. Human-induced climate change promotes the conditions on which wildfires depend, enhancing their likelihood and challenging suppression efforts. Human-induced warming has already led to a global increase in the frequency and severity of fire weather, increasing the risks of wildfire. This signal has emerged from natural variability in many regions, including the western US and Canada, southern Europe, Scandinavia and Amazonia. Human-induced warming is also increasing fire risks in other regions, including Siberia and Australia. Nonetheless, wildfire activity is determined by a range of other factors including land management and ignition sources, and on the global-scale most datasets indicate a reduction in burned area in recent years, chiefly due to clearing of natural land for agriculture.
Background. The Fifth Assessment Report of the Intergovernmental Panel on Climate Change (IPCC) published in 2013 identified several climate trends that have the potential to influence fire weather:
- Global increases in average temperature.
- Global increases in the frequency, intensity and/or extent of heatwaves (i.e. the breaching of historically extreme temperature thresholds).
- Regional increases in the frequency, duration and intensity of drought.
Fire weather used here refers to periods with a high likelihood of fire due to a combination of high temperatures, low humidity, low rainfall and often high winds. Rising global temperatures and more frequent heatwaves and associated droughts increase the likelihood of wildfire by promoting hot and dry conditions, which are conducive to fire weather. Changes in rainfall and its seasonality complicate trends in fire weather, and so reductions in fire weather are possible in some regions. Nonetheless, wildfire occurrence is moderated by a range of factors including land management practises, land-use change and ignition sources. At the global-scale, burned area has decreased in recent decades, likely due to clearing of natural land cover for agriculture and increased fire suppression.
Observations
The impact of anthropogenic climate change on fire weather is emerging above natural variability. Jolly et al. (2015) use observational data to show that fire weather seasons have lengthened across ~25% of the Earth’s vegetated surface, resulting in a ~20% increase in global mean fire weather season length. By 2019, models suggest that the impact of anthropogenic climate change on fire weather was detectable outside the range of natural variability in 22% of global burnable land area (Abatzoglou et al., 2019). Regional studies corroborate these global findings by identifying links between climate change and fire weather, including in the following regions with major recent wildfire outbreaks:
- Amazonia. Models suggest that the impacts of anthropogenic climate change on fire weather extremes and fire season length emerged in the 1990s (Abatzoglou et al., 2019). Drought-induced fires may be partially offsetting reductions in Amazonian deforestation fires since ~2000 (Aragão et al., 2018). Climate-driven changes in fire weather are exacerbated by landscape fragmentation caused by deforestation (Alencar et al., 2015; Aragão et al., 2018; Brando et al., 2013).
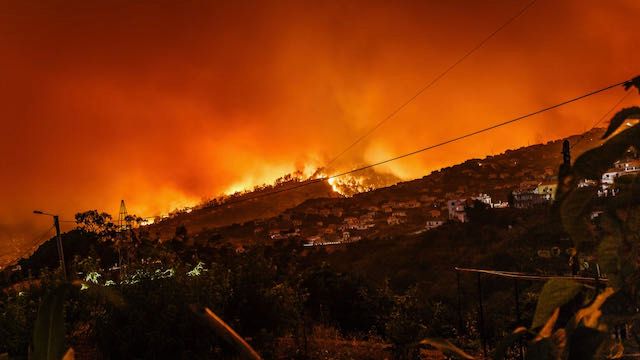
- Southern Europe / Mediterranean. Models suggest that the impacts of anthropogenic climate change on fire weather extremes and fire season length emerged in the 1990s (Abatzoglou et al., 2019). Several articles identify an emerging link between heat waves, drought and fire in Southern Europe (e.g. Ruffault et al., 2017; Parente et al., 2018; Koutsias et al., 2013).
- Scandinavia. Models suggest that the impacts of anthropogenic climate change on fire weather extremes and fire season length emerged in the 2000s (Abatzoglou et al., 2019). Krikken et al. (2019) found that the 2018 fires in Sweden were ~10% more likely in the current climate than in the pre-industrial climate and that a greater increase in the fire weather is likely in the future.
- Western US and Canada. Models suggest that the impacts of anthropogenic climate change on fire weather extremes and fire season length emerged in the 2010s (Abatzoglou et al., 2019; Williams et al., 2019; Abatzoglou & Williams, 2016). Yoon et al. (2015) similarly predicted the occurrence of extreme fire risk would exceed natural variability in California by 2020. Kirchmeir-Young et al. (2017) found that the 2016 Fort McMurray fires were 1.5 to 6 times more likely due to anthropogenic climatechange, compared to natural forcing alone. Westerling et al. (2016) found that burned area was >10 times greater in Western US forests in 2003-2012 than in 1973-1982. The 2015 Alaskan wildfires occurred amidst fire weather conditions that were 34-60% more likely due to anthropogenic climate change (Partain et al., 2016).
Climate change also affects fire weather in many other regions, although formal detection does not yet emerge from natural variability. Abatzoglou et al. (2019) suggest that the anthropogenic climate change signal will be detectable on 33-62% of the burnable land area by 2050. Other global studies agree that the effect of climate change is to increase fire weather and burned area once other factors have been controlled for (e.g. Huang et al., 2015; Flannigan et al., 2013). Regional modelling studies corroborate these global findings by projecting how climate change will affect fire weather:
- Siberia. Both the number of forest fires and the extent of the burned area increased during recent decades (Ponomarev et al. 2016). Models suggest that the increased frequency and severity of fire weather will be most pronounced in the northern boreal region, including Siberia (Flannigan et al., 2013; de Groot et al., 2014). Impacts of anthropogenic climate change on fire weather extremes and fire season length are projected to emerge above natural variability in the 2020s (Abatzoglou et al., 2019).
- Australia. Observational data suggest that fire weather extremes are already becoming more frequent and intense (Dowdy, 2018; Head et al., 2014). However, the divergence between anthropogenic and natural forcing signals is weaker, and more challenging to diagnose, than in other regions due to strong regional and inter-annual variability in the effect of the El Niño–Southern Oscillation on fire weather (Dowdy, 2018; Sharples et al. , 2016). Other important regional weather patterns, such as the Indian Ocean Dipole (IOD) and the Southern Annular Mode (SAM) also contribute to natural variability in fire weather, but their effects are increasingly superimposed on more favourable background fire weather conditions. Impacts of anthropogenic climate change on fire weather extremes and fire season length are projected to emerge above natural variability in the 2040s (Abatzoglouetal., 2019).
Continuing trends in regions where an anthropogenic signal has already emerged. Models project that the length of fire weather season will increase by more than 20 days per year in the northern high latitudes by the end of this century (Flannigan et al., 2013). Models also indicate that current “100-year” fire events, in terms of burned area, will occur every 5 to 50 years across Europe by the end of the century (Forzieri et al., 2016). Modelling of Alaskan fire risk indicates a four-fold increase in the 30-year probability of fire occurrence by 2100 due to climate change (Young et al. , 2017).
Paleo records also support increased wildfires during warmer periods. Sedimentary charcoal records and other indicators of fire activity have been used to extend records of fire throughout the Holocene period (the past 12,000 years) and beyond, enabling assessment of long-term interactions between climate and biomass burnt (Marlon et al., 2013, 2016). Other model–data comparisons reveal robust correspondence between fire and climate during the Holocene in most regions, though this correspondence can break down in regions with significant direct human control via fire ignition and suppression, including in Europe (Brücher et al., 2014). Harrison et al. (2018) later used model–data comparison to demonstrate that biomass burning has increased with rising temperature over the past 1500 years. In Australia, charcoal production correlates with temperature during major historical climate transitions and the role of direct human activities is not evident (Williams et al, 2015).
Overall, the 57 papers reviewed clearly show that human-induced warming has already led to a global increase in the frequency and severity of fire weather, increasing the risks of wildfire.
Fire weather only translates to fire activity and burned area if natural or human ignitions occur, and hence the sensitivity of burned area to changes in fire weather varies regionally (Bedia et al., 2015; Archibald et al., 2013). Correlation between fire weather and burned area is strongest in the boreal and tropical forests, where fire weather is the main limitation to fire. On the other hand, burned area is insensitive to fire weather in regions where fuel stocks or human suppression are the key fire limitations.
Humans can directly affect wildfire occurrence by managing fuel loads and also suppressing ignitions during fire weather. Globally, humans have reduced the global extent of burned area in recent decades (Andela et al., 2017; Forkel et al. 2019; Doerr and Santin, 2016; Bestinas et al., 2014), and probably the last century (Arora et al., 2018). Nonetheless, direct human effects on burned area show significant regionality. While the conversion of savannahs to agricultural land has been the principal driver of the reduced global burned area in recent decades, burned area has increased in closed-canopy forests and is associated with rising population, cropland and livestock density (Andela et al., 2017; Arora et al., 2018). As a regional example, Syphard et al. (2017) find that climate influences on fire weather in the Mediterranean have been countered by direct suppression of fires since ~1970.
Future projections
Future risks posed by wildfires may be significantly reduced by limiting temperature increase to well below 2°C. Several studies have investigated the impacts of limiting global warming to 1.5°C, 2°C and/or 3°C above pre-industrial levels. Globally, the area with a detectable impact of anthropogenic climate change on fire weather is twice as large at 3°C than at 2°C (Abatzoglou et al. , 2019). These changes in fire weather may translate to increases in burned area. For example, Turco et al. (2018) find that a 1.5°C temperature increase above pre-industrial in the Mediterannean leads to a 40% increase in burned area, whereas a larger temperature gain of 3°C leads to a doubling of burned area. Burton et al. (2018) investigated the impact on fire weather of limiting global warming to 1.5°C and 2°C above pre-industrial levels, where a 2°C limit is achieved by applying substantial and rapid greenhouse emissions reductions and a 1.5°C limit is achieved by also including solar radiation management (stratospheric SO2 injection). The results indicate that a 1.5°C limit reduces fire weather globally compared with a 2°C limit, however solar radiation management may in fact worsen fire weather in some regions and must therefore be carefully considered.
This independent ScienceBrief review is consistent with the “Fire and Climate Change” summary of the 2019 IPCC Special Report on Climate Change and Land, which states that:
- Climate change is playing an increasing role in determining wildfire regimes along-side human activity, with future climate variability expected to enhance the risk and severity of wildfires in many biomes such as tropical rainforests.
- Fire weather seasons have lengthened globally between 1979 and 2013.
- Global land area burned has declined in recent decades, mainly due to less burning in grasslands and savannas.
The Brief and evidence can be explored at: https://sciencebrief.org/topics/climate-change-science/wildfires.
Full version in pdf format here.
ScienceBrief is a web platform that helps make sense of peer−reviewed publications and keep up with science. It is written by scientists. ScienceBrief Reviews support transparent, continuous, and rapid reviews of current knowledge. ScienceBrief is supported by the University of East Anglia and was initiated with funding from the UK NERC International Opportunities Fund (NE/N013891/1). The ScienceBrief platform is developed by Anthony Jude De−Gol.
4. Climate change increases the risk of wildfires
September 2020 update
- Tyndall Centre for Climate Change Research, School of Environmental Sciences, University of East Anglia (UEA), UK.
- Management of Complex Systems, University of California, Merced, Merced, CA, USA.
- CSIRO Oceans and Atmosphere, G.P.O. Box 1700, Canberra, ACT 2601, Australia.
- Met Office Hadley Centre, Exeter, UK.
- College of Life and Environmental Sciences, University of Exeter, UK.
Full version in printable format here.
This ScienceBrief Review is part of a collection on Critical Issues in Climate Change Science, prepared for the COP26 climate conference to be held in Glasgow (2021). Eds: Corinne Le Quéré, Peter Liss, Piers Forster.
Approach. We undertook a ScienceBrief Review on the link between climate change and wildfire risk in January 2020, reviewing 57 scientific articles. 116 scientific articles are now available. This update focuses on articles relevant to the wildfires ongoing in the western United States, new findings relevant to the wildfires that raged in southeastern Australia during the 2019-2020, and new findings since January 2020. The full Brief and all publications can be viewed at: https://sciencebrief.org/topics/climate-change-science/wildfires.
Summary. New scientific publications reviewed since January 2020 strengthen the evidence that climate change increases the frequency and/or severity of fire weather – periods with a high fire risk due to a combination of high temperatures, low humidity, low rainfall and often high winds – in many regions around the world. The western United States is among the regions where the trends in fire weather have been most pronounced in the past at least 40 years. Fire activity is influenced by a range of other factors including land management practices. However, land management alone cannot explain recent increases in wildfire extent and intensity in the western US or southeast Australia because increased fire weather amplifies fire risk where fuels remain available.
Key points
The new analysis shows that:
- Well over 100 studies published since 2013* show strong consensus that climate change promotes the weather conditions on which wildfires depend, enhancing their likelihood.
- Natural variability is superimposed on the increasingly warm and dry background conditions resulting from climate change, leading to more extreme fires and more extreme fire seasons.
- Land management can enhance or compound climate-driven changes in wildfire risk, either through fuel reductions or fuel accumulation as unintended byproduct of fire suppression. Fire suppression efforts are made more difficult by climate change.
- There is an unequivocal and pervasive role of climate change in increasing the intensity and length in which fire weather occurs; land management is likely to have contributed too, but does not alone account for recent increases in wildfire extent and severity in the western US and in southeast Australia.
Background
Human-induced climate change promotes the conditions on which wildfires depend, enhancing their likelihood and challenging suppression efforts. Although the global area burned by fires each year is declining, the majority of this trend is explained by conversion of natural savannahs and grasslands to agriculture in Africa (Andela et al. 2017). In contrast, the area burned by forest wildfires is increasing in many regions, including in the western US and southeast Australia. Here we focus on the impacts of climate change on “fire weather”, which affects the likelihood of fires occurring and the severity of fires when they do occur.
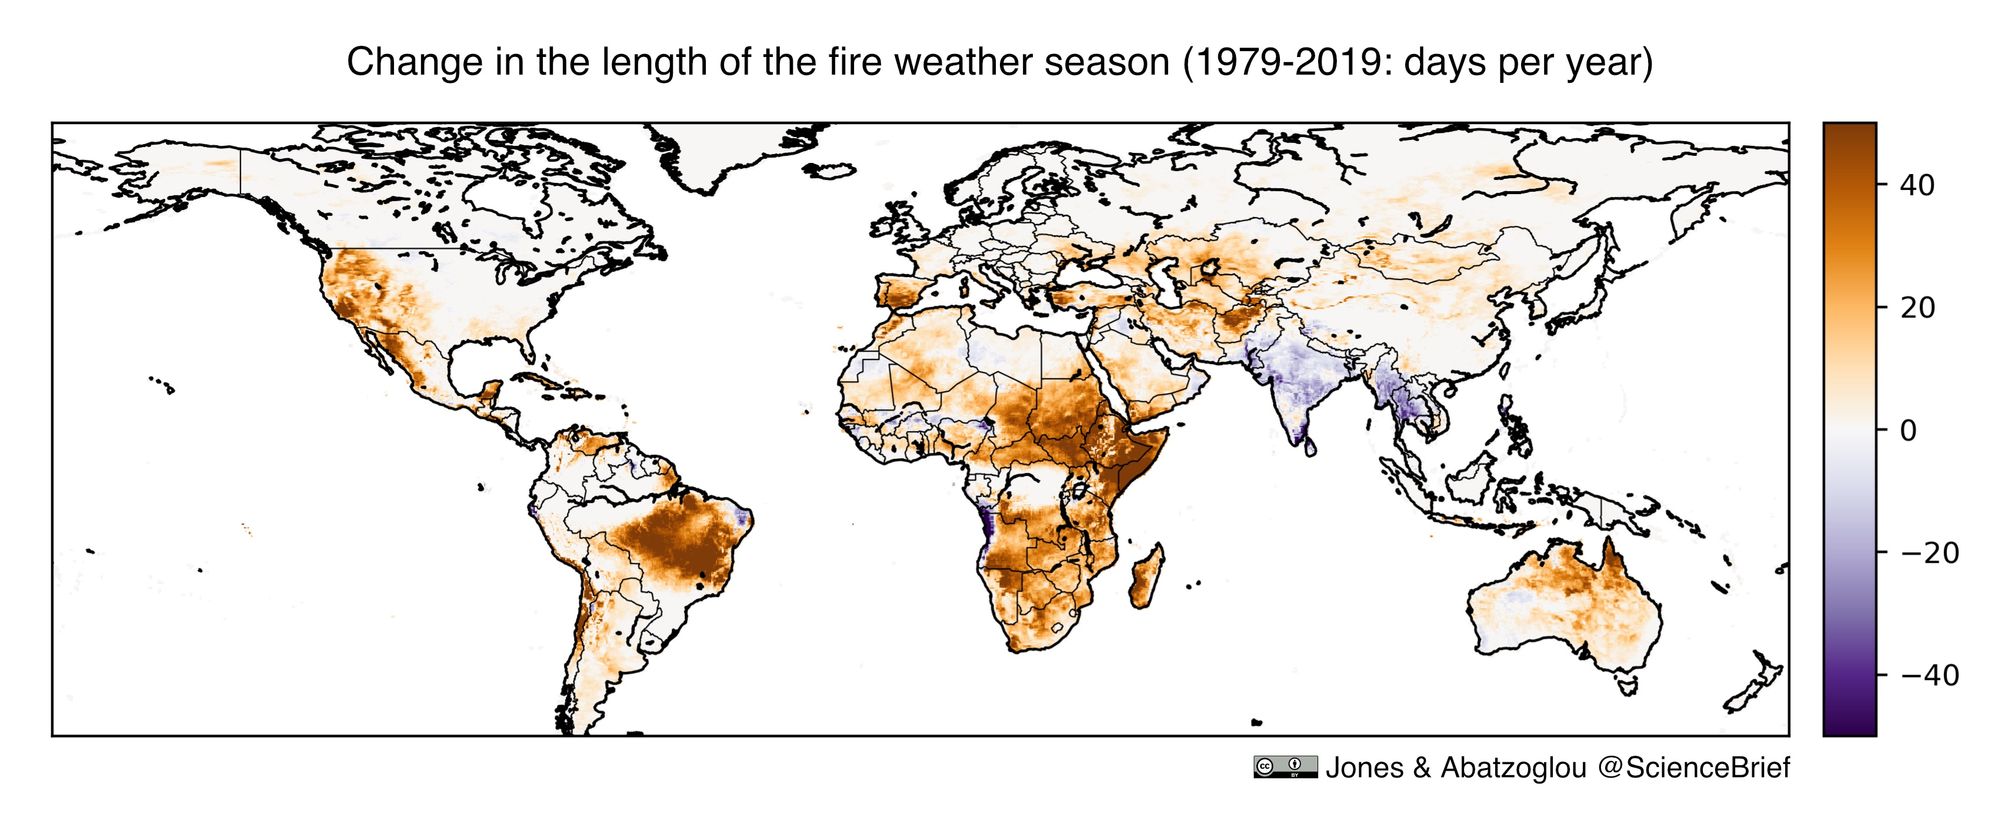
“Fire weather” refers to periods with a high likelihood of fire due to a combination of high temperatures, low humidity, low rainfall and often high winds. A number of indices are used to track fire weather based on the meteorological information available, and these indices broadly quantify the risk of fire based on weather conditions at any given time and place. “Fire weather season length” refers to the number of days per year of fire weather. Fire weather season length is on the rise globally, signalling a rising risk of wildfires in many regions (see Figure 1).
Observations
Human-induced warming has already led to a global increase in the frequency and severity of fire weather, increasing the risks of wildfire. Rising global temperatures and more frequent heatwaves increase the frequency of fire weather by promoting hot and dry conditions, despite an increase in global mean precipitation which falls more sporadically. Fire weather seasons have significantly lengthened across 25% of the Earth’s vegetated surface, with detectable climate change impact above natural variability over a similar extent (Abatzoglou et al., 2019). These impacts will become increasingly pervasive and intense with each added degree of warming. While there are regional exceptions, the global picture is of a hotter world that supports longer and more extreme fire seasons (see Figure 1).
Land management can enhance or compound climate-driven changes in wildfire risk. Prescribed burning during the cooler season can reduce available fuel and therefore reduce the likelihood or intensity of subsequent fires. Fire suppression and increased residues from logging can enhance the intensity of wildfires when they occur. Fuel reductions or the maintenance of fire breaks around population centres can help to avoid the worst direct impacts of wildfire on communities, and is particularly effective around populated centres. Fire management is highly sensitive to local climate and landscape conditions, both of which have changed in recent decades due to climate change and other factors, such as population growth.
Wildfires can have broad impacts for human health and wellbeing and for the natural environment. Impacts include deaths directly from fire and indirectly from associated air pollution, loss of property, accelerated thawing of permafrost, amplification of climate change, and biodiversity loss.
Climate change and wildfire in the Western US
The western US is exposed to greater wildfire risks than it was before humans began to alter the global climate. The legacy of fire suppression and exclusion of indigenous land stewardship have increased vegetation density in the region thereby contributing to recent wildfires.
Fire weather has become more frequent and intense in western US forests. Fire weather has become more frequent and intense in recent decades, lengthening by 8 days between 1979 and 2019 on average globally (Jolly et al., 2015; Figure 1). The US is among the regions where the frequency and severity of fire weather has shifted beyond the natural conditions seen in the pre-industrial period (Abatzoglou et al., 2019). Goss et al. (2020) found that climate change is increasing the likelihood of extreme autumn wildfire conditions across California with a doubling of such days over the past four decades. Williams et al. (2019) also found that warming is enhancing the potential for large wildfires in autumn, which typically occur during strong, dry offshore winds and when winter precipitation is delayed. Khorshidia et al (2020) finds that megafire days (confluence of dry fuels/strong winds) in southern California has increased by 3x over this same period. Finally, Crockett et al. (2018) finds that extreme wildfires happen more frequently during droughts, compounding the effects of climate trends and climate variability. Overall, climate change is bringing hotter, drier weather to the western US and the region is fundamentally more exposed to fire risks than it was before humans began to alter the global climate. Recent trends in fire weather are projected to continue under a warming climate, with a 25% increase in extreme autumn fire days projected for California by the late 21st century, even for a medium scenario of future emissions (RCP 4.5; Goss et al., 2020).
Fire weather is driving more wildfire activity in western US forests. Hotter, drier weather means forests are being primed to burn more regularly, and this has led to an increase in fire activity in recent decades. Williams et al. (2019) found that Californian forests experienced an eightfold increase in summer forest fire extent during 1972–2018, and that nearly all of the increase could be explained by increased fuel dryness in the context of contemporary fire management. In the wider western US forests, Westerling et al. (2016) found that annual burned area increased tenfold between 2003–2012 and 1973–1982. Increases in summer wildfire area have occurred principally due to increased fuel dryness under a warming climate that has been accompanied by reduced summer precipitation (Halofsky et al., 2020; Williams et al., 2019; Abatzoglou & Williams, 2016; Holden et al., 2018), in the context of modern land management and fire suppression practices.
Demographic factors alone cannot account for the magnitude of the observed increase in wildfires in the western US, but increased population leads to greater impacts. In addition to climate change, the increased population at the wildland-urban interface (WUI) is contributing to greater impacts of wildfires, with more people, property and infrastructure at risk (Syphard et al. 2019, Hanberry, 2020; Radeloff et al., 2020). Strader (2018) found that there was a >100–fold increase in homes built in high fire risk zones during 1940–2010, while 97% of US wildfires in the WUI result from human ignition (Mietkiewicz et al., 2020). Observations reveal weaker climate–fire relationships where human populations are higher, due to both ignitions, land fragmentation, and suppression (Syphard et al., 2017). While studies from elsewhere in the world have shown that a rising rural population leads to higher human ignitions, especially along new highways (Oliveira et al., 2017), studies in California have not revealed such an effect where the number of ignitions has declined slightly over the past four decades (Keeley and Syphard, 2018).
Land management practices are contributing factors, but cannot alone explain the magnitude of the observed increase in wildfires extent in the western US forests in recent decades. Prescribed burning is one mechanism for removing the most flammable excess fuels from the forest floor. However, negative perceptions towards the practice and a closing window of opportunity to conduct the burns safely each year mean that these prescribed burns are conducted less regularly than desired in some regions (Miller et al., 2020). Limited fuel management through hazard reduction fires has been suggested by some (Kolden, 2019; Miller et al., 2020; Moreira et al., 2020) as a contributing factor to the increasing scale and impact of wildfires in the western US (and other regions with Mediterranean–type climate). A long history of fire suppression hasve also contributed to elevated wildfire risk because fuel stocks are out of sync with their natural dynamics. Increased forest residues from reduced frequency of low–intensity fires enhance the likelihood of fires being highly impactful when they do occur (Moreira et al., 2020). Likewise, the implementation of widespread fuel treatments reduce the proportion of high–severity fires (Liang et al., 2018) under future climates in the Sierra Nevada. The influence of land–management practices on fire activity is ecosystem–dependent; for example, fire suppression practices may have little bearing on changes in burned area in sub-alpine ecosystems with climate change (Hansen et al., 2019). However, Goss et al. (2020) concluded that “the broad geographic extent of increased burned area in California and the western US suggests that demographic and forest management factors alone are insufficient to explain the magnitude of the observed increase in wildfire extent over the past half–century”.
Climate contribution to the 2019–2020 Australian bushfires
Extreme heat and drought in Australia during the fire season of 2019–2020 (and prior years of drought) led to an unprecedented fire season in the forests of the southeast of the country. The weather conditions were partly a result of human–driven climate change. Long term accumulation of fuels as a result of fire suppression and logging practices likely contributed to the severity and extent of fire activity.
The scale of the 2019-20 bushfires was unprecedented. A globally unprecedented 21% of the Australian temperate and broadleaf mixed (TBLM) forest biome burned during the 2019-2020 bushfires. This is believed to be due to record low levels of moisture in the leaf litter layer, which propagate TBLM fires, following a period of record-breaking heat and extended drought, coupled with windy conditions in early September 2019 (Boer et al., 2020). While this period of elevated fire weather is consistent with predictions of climate change, formal attribution studies for the 2019–2020 Australian wildfires are still in progress.
Fuel management through prescribed burns and improved logging practice cannot fully mitigate increased wildfire risk due to climate change. Recent analysis found 36% of the 2019–2020 burned area in Victoria had been burned twice or more in the previous 25 years, (Lindenmayer & Taylor, 2020) suggesting limited effectiveness of prescribed burns to mitigate wildfires in these areas. Lindenmayer et al. (2020) identified that, in addition to climate change, logging residues from poor forestry practices in Victoria contributed to the intensity of the 2019–2020 megafires. However, Di Virgilio et al. (2020) demonstrate that in southeastern Australia, climate change has reduced the window for safe use of prescribed burns to manage forest fuel loads, limiting future effectiveness of this tool. Extended fire–season length in other regions would mean this also applies elsewhere. To prevent future extreme or catastrophic fires in forests, using fuel management alone, Clarke et al. (2020) suggest that landscape–scale changes in vegetation type would be required, not merely management of existing vegetation.
Extreme weather and Pyroconvection are projected to increase wildfire risk under future climate change in southeastern Australia. Research published before the 2019-2020 bushfires revealed that surface fire weather conditions and atmospheric instability can interact during major fires, as heat and moisture are released (Dowdy & Pepler, 2018; Di Virgilio et al., 2019; Dowdy et al., 2019). Known as pyroconvective circulation, temperature and humidity changes above the fire and can develop thunderstorms and pyrocumulonimbus clouds, resulting in catastrophic wildfires that are even more dangerous, because wind speed and direction changes erratically (Dowdy & Pepler, 2018). Reanalysis data (1979–2016) for southeast Australia, show pyroconvection risk increased over time, especially during spring and summer, due to worsening surface fire weather conditions (Dowdy & Pepler, 2018). Future projections (2060–2079) suggest that climate change may continue to increase the risk of pyroconvection in southeastern Australia, compared to 1990–2009. This increase is notable in November (spring) and to a lesser extent during December (summer), though a trend was not clear for all regions of the country (Di Virgilio et al., 2019; Dowdy et al., 2019).
New evidence from elsewhere in the world
Scientific evidence that climate change is causing an increase in the frequency and extent of fire weather, contributing to extreme wildfires around the world, continues to mount.
In the Mediterranean region, anthropogenic climate change signal has been detected separately from natural variability in southern France and was responsible for 50% of the increase in fire weather (Barbero et al., 2020). Fargeon et al. (2020) report that under a high emissions scenario (RCP 8.5) for the future, climate change signal emerges from natural variability in most of France after 2060. Positive temperature, negative humidity and zonal wind anomalies in the Iberian Peninsula correlate with large fires (Vieira et al., 2020) that are projected to increase in the number of extreme days and normalised burned area by 2071–2100, under both a medium (RCP 4.5) and a high (RCP 8.5) emissions scenario (Calheiros et al., 2021). For the Mediterranean region as a whole, fire weather is projected to increase 14–30% by the late 21st century, depending on future emissions scenarios. In Central Asia, fire weather is projected to increase by 63–146% and burned area by 3–13% by 2071–2099, depending on future emissions scenarios (Zong et al., 2020).
The Brief including all references to publications, can be explored at: https://sciencebrief.org/topics/climate-change-science/wildfires.
Full version in pdf format is available here.
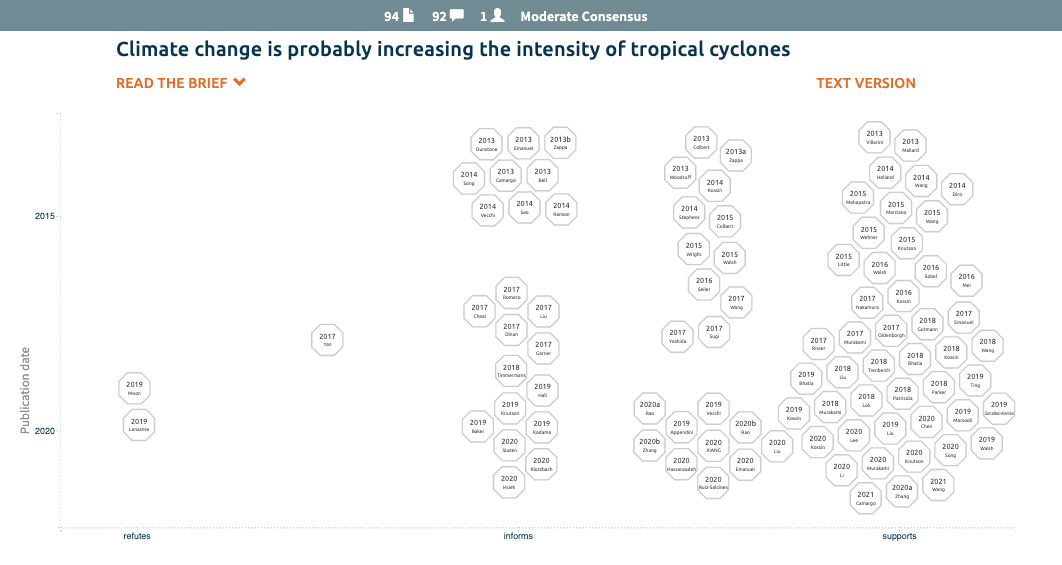
5. Climate change is probably increasing the intensity of tropical cyclones
- National Oceanic and Atmospheric Administration (NOAA), Geophysical Fluid Dynamics Laboratory, Princeton, NJ 08540, USA
- Atmospheric and Oceanic Sciences Program, Princeton University, Princeton, NJ 08540, USA
- High Meadows Environmental Institute, Princeton University, Princeton, NJ 08540, USA
- Department of Geosciences, Princeton University, Princeton, NJ 08540, USA
- Tyndall Centre for Climate Change Research, School of Environmental Sciences, University of East Anglia (UEA), Norwich, UK.
Full version in printable format here.
This ScienceBrief Review is part of a collection on Critical Issues in Climate Change Science, prepared for the COP26 climate conference to be held in Glasgow (2021). Eds: Corinne Le Quéré, Peter Liss, Piers Forster.
Approach. This ScienceBrief Review examines the link between climate change and tropical cyclones (TCs, including tropical storms, hurricanes, and typhoons). It synthesises findings from more than 90 peer−reviewed scientific articles gathered using ScienceBrief. The Brief and evidence can be viewed at: sciencebrief.org/topics/climate_change_science/cyclones.
Summary. Warming of the surface ocean from anthropogenic (human-induced) climate change is likely fuelling more powerful TCs. The destructive power of individual TCs through flooding is amplified by rising sea level, which very likely has a substantial contribution at the global scale from anthropogenic climate change. In addition, TC precipitation rates are projected to increase due to enhanced atmospheric moisture associated with anthropogenic global warming. The proportion of severe TCs (category 3 & 5) has increased, possibly due to anthropogenic climate change. This proportion of very intense TCs (category 4 & 5) is projected to increase, yet most climate model studies project the total number of TCs each year to decrease or remain approximately the same. Additional changes such as increasing rates of rapid intensification, the poleward migration of the latitude of maximum intensity, and a slowing of the forward motion of TCs have been observed in places, and these may be climate change signals emerging from natural variability. While there are challenges in attributing these past observed changes to anthropogenic forcing, models project that with global warming in coming decades some regions will experience increases in rapid intensification, a poleward migration of the latitude of maximum intensity or a slowing of the forward motion of TCs.
Key points.
It is extremely likely that human influence has been the dominant cause of the observed global warming since 1951, according to the IPCC Fifth Assessment Report (Bindoff et al., 2013). Further warming will likely lead to an increased proportion of TCs of higher severity (category 4 & 5) with more damaging wind speeds, higher storm inundation, and more extreme rainfall rates (Knutson et al., 2015; 2019; 2020; Walsh et al., 2016; 2019).
- Observations since about 1980 show that, globally, the intensity and rate of intensification of TCs has increased slightly, with a stronger positive trend observed for the North Atlantic. Modelling studies, supported by a theory of potential intensity of TCs, find that future mean intensities are projected to increase by about 5% for a +2C global warming scenario.
- The global average proportion of intense TC occurrence (category 3 or higher; i.e., 1-minute maximum wind speeds of 50 m/s or higher) has increased since 1979, and the proportion of category 4-5 storms (winds 58 m/s or higher) is projected to increase substantially under a warming climate.
- The IPCC Fifth Assessment Report (Bindoff et al. 2013) conclude that an anthropogenic contribution to increased near-surface specific humidity has been identified with medium confidence in observations. They also conclude that it is very likely that there has been a substantial anthropogenic forcing contribution to observed global mean sea level rise since the 1970s. Rising sea levels lead to higher average inundation levels from TCs, all else being equal, while enhanced atmospheric moisture probably leads to greater rainfall rates in TCs, based on theoretical expectations and TC simulations. These changes enhance the risk of flooding from individual TCs, and are projected to accelerate as warming continues. Storm surge and flooding rainfall from TCs are extremely important for societal impacts of TCs as they have been principal drivers of many of the large human loss-of-life disasters associated with TCs.
- Larger and more intense TCs tend to cause more damage than smaller, weaker storms, so shifts toward a greater proportion of intense storms are of concern. Historical normalised economic damage from TCs for the U.S. since 1900 is closely linked to storm minimum sea level pressures, which in turn are related to both storm intensity and size. However, there is as yet no significant trend in U.S. landfalling major hurricane frequency since 1900, as measured by minimum sea level pressures (Klotzbach et al., 2020), and this is the longest available record of intense (category 3 or higher) TC activity.
- The observed global total number of TCs (including tropical storms and category 1−5 TCs) has not changed significantly in recent decades. Total TC records include weaker TCs below major hurricane intensity, which statistically tend to be less damaging, yet these TC records also comprise some of the longest observational records of TCs for trend analysis. Century-scale records of landfalling hurricanes for the U.S., TCs for Japan, and severe TCs for northeast Australia all show significant decreases or little change (Knutson et al., 2019). Century-scale recorded increases in Atlantic basin-wide hurricane and tropical storm frequency are not considered reliable but are consistent with the impact of improved data quality. While the number of TCs is projected to decrease globally in most studies, there is uncertainty, with increases or neutral trends predicted by some models. Regional TC frequency changes are of mixed sign in model projections and exhibit large spread.
- Quantitative contributions of anthropogenic climate change to the global TC intensification or increase in the proportion of intense tropical cyclones have not been confidently established, in large part, because of sizeable potential contributions from natural multi-decadal variability and non-greenhouse gas forcing since the 1970s, when hurricane data is of the highest quality. Trends in TC data can also be difficult to detect because the instrumentation used to measure TC characteristics is itself evolving in time.
- Observations indicate that the latitude of maximum intensity of TC activity has migrated poleward, particularly in the northwest Pacific basin. This change has been assessed as unusual compared with expected natural climate variability with low-to-medium confidence, raising the potential that TCs at high intensity may begin to impact locations further poleward than they have previously, potentially affecting areas that may be less well adapted.
Observations and detection/attribution of changes
The intensity of TCs has increased globally in recent decades, with the proportion of category 3-5 cyclone occurrence growing by around 5% per decade since 1979, according to satellite-based intensity estimates (Kossin et al., 2020). Statistically significant increases were observed globally and in several basins, including the North Atlantic basin by Kossin et al. (2020). Observations since the 1980s indicate that globally, and to a greater degree in the North Atlantic, the likelihood of TC rapid intensification (RI, when TC intensity changes by more than 18 m/s in 24 hours) has increased (Bhatia et al., 2019). In terms of the longest available records of category 3-5 TCs, the frequency of landfalling major hurricanes for the U.S. exhibits no significant trend since 1900 (Klotzbach et al., 2020), nor does a U.S. landfalling TC power dissipation index indicate any significant trend since 1900 (Landsea, 2005).
- In the western North Pacific, tropical cyclones making landfall in eastern and south-eastern Asia have increased in intensity over 1977-2014 by +12 to +15% (Mei and Xie, 2016).
- In the North Indian basin, Mohapatra et al. (2015) find, based on observations over 1951-2010 (monsoon and post-monsoon seasons), that the probability of cyclonic disturbances intensifying into tropical cyclones has increased in the Arabian Sea in association with decreased vertical wind shear. They further report that the probability of tropical cyclones intensifying into severe tropical cyclones has increased over the Bay of Bengal in association with increased low-level cyclonic vorticity. For the Arabian Sea, model simulations suggest that recent increases in the occurrence of extremely severe tropical cyclones in the post-monsoon season are likely due in part to anthropogenic forcing (Murakami et al., 2017).
- In the North Atlantic basin, increasing intensity and intensification rate trends are interpreted as responding to some combination of changes in atmospheric aerosol concentration, human−caused changes in greenhouse gas concentrations, and natural variability (Bhatia et al., 2019). Past changes in aerosols have been suggested as important in driving changes in the intensity of North Atlantic hurricanes over recent decades (Villarini and Vecchi, 2013), with increases in aerosol emissions after World War II and decreases after the 1970s driving Atlantic hurricane intensity decreases and increases, respectively. Further research is required to better constrain the relative contributions of these different influencing factors to the observed changes (Walsh et al., 2019).
The modelled effect of human−induced climate change on TC intensities is qualitatively consistent with the observed increases, but it is not clear whether an anthropogenic influence on TC intensity or proportion of intense TCs is distinguishable from natural variability at present (see review in Knutson et al., 2019). In one study, Bhatia et al. (2019) demonstrate that observed increases in TC rapid intensification in the Atlantic in recent decades are highly unusual (though not unprecedented) compared to one model’s simulation of natural internal variability, an example of using modelled climate variability to test for how unusual an observed trend is estimated to be compared to natural variability.
The latitude of maximum tropical cyclone intensity has migrated polewards in both hemispheres, coinciding with the poleward expansion of tropical boundaries observed in some regions (Kossin et al., 2016; Walsh et al., 2019; Staten et al., 2020). During the past 30 years, peak cyclone intensity has migrated on the order of 50-60 km per decade in each hemisphere (Kossin et al., 2014). However, while Kossin et al. (2016) show that the observed poleward migration of the latitude of maximum TC intensity in the western North Pacific is robust to statistical removal of Pacific Decadal Oscillation and El Niño/Southern Oscillation signals, there remains uncertainty regarding the extent to which the TC changes result from human−caused greenhouse warming; Knutson et al. (2019) concluded that there is low-to-medium confidence that the changes are highly unusual compared to natural variability.
- Northward migration of the latitude of maximum tropical cyclone intensity has been especially pronounced in the northwest Pacific (Kossin et al., 2016).
- In recent decades, cyclone exposure in the western North Pacific has decreased in the Philippines and the South China Sea while increasing in the East China Sea, Japan, and the Korean Peninsula (Colbert et al., 2015; Kossin et al., 2016; Xiang et al., 2020).
- In the North Indian basin, northward migration of the mean latitude of cyclone formation has been observed since the mid 20th century (Mohapatra et al., 2015).
- A statistically significant movement of TCs toward land regions has been observed globally and in the northwest Pacific basin during 1982-2018 (Wang and Toumi, 2021), although the relative contributions of natural variability and anthropogenic forcing to this observed trend have not been established.
The forward motion (translation speed) of tropical cyclones may have slowed over the continental U.S. since 1901 (Kossin, 2019), although the causes of this decline are uncertain. It is possible that this change represents a climate change trend emerging from the background of natural variability. In contrast, while a slowing was observed globally since the mid-20th century (Kossin, 2018; 2019), the majority of this decline was during 1949−1981, with a weak or no trend in later observations (Zhang et al., 2020). It has also been suggested that the global decline could instead be due to systematic data biases (Moon et al., 2019) or natural variability, possibly combined with changes in measurement technology after the introduction of satellite-based remote sensing of tropical cyclones in the 1960s (Lanzante, 2019). Slower forward propagation speed can be important for tropical cyclone impacts, including an increase in rainfall and flooding, due to the longer duration a tropical cyclone is within the same area (Kossin, 2018).
Concerning extreme TC precipitation events, formal detection and attribution studies of individual events (Van Oldenborgh et al., 2017) suggest possible human contributions to observed extreme precipitation events from all sources, including TCs and other influences. The IPCC Fifth Assessment Report (Bindoff et al. 2013) conclude that there is medium confidence that anthropogenic forcing has contributed to intensified heavy precipitation in general at the global scale since the mid-20th century. They did not separately assess TC-related precipitation extremes. Theoretical and model-based research suggest a warming-induced increase in extreme TC-related rainfall rates (Knutson et al. 2020; Liu et al. 2020). However, an anthropogenic influence on observed TC-related rainfall that is outside the range of estimated natural variability has not yet been demonstrated in existing studies.
- One extreme precipitation event was driven by Hurricane Harvey, which made landfall over Texas in August 2017, with very slow forward motion (translation speed) leading to extremely high multi-day rainfall totals over the Houston area. Observed 3−day total precipitation exceeded 750 mm over a large area (van Oldenborgh et al., 2017). In the early northern summer of 2017, the ocean heat content and sea surface temperature of the Gulf of Mexico were at (then) record high levels, providing the energy for intense evaporation, moistening the atmosphere (Trenberth et al., 2018). Trenberth et al. (2018) assert that the intensity of rainfall during Hurricane Harvey could not have occurred without human−caused climate change. Event attribution studies estimated that climate change was responsible for approximately +15% to +38% increased rainfall intensity and a +3 to +3.5−fold increase in the likelihood of extreme multi-day precipitation events, such as the one associated with Hurricane Harvey (van Oldenborgh et al., 2017; Risser and Wehner, 2017). It was also found that urbanisation exacerbated the rainfall and flooding in Houston from Hurricane Harvey (Zhang et al. 2018).
For tropical cyclone frequency (including tropical storms and category 1-5 TCs), the observed total global annual number has not changed significantly in recent decades. While total TC frequency includes weaker TCs below category 3 intensity, which statistically tend to be less damaging, long TC frequency records also comprise some of the longest observational records of TCs for trend analysis. Therefore, they can be useful for climate change detection/attribution studies, which are looking for evidence of emerging greenhouse gas-induced trends.
Century-scale records of landfalling tropical cyclones for the U.S., Japan, and northeast Australia show significant decreases or little change (Knutson et al., 2019). Century-scale recorded increases in Atlantic basin-wide hurricane and tropical storm frequency are consistent with the impact of improved monitoring, which suggests that these recorded increases should not be interpreted strictly as climate change signals (Vecchi and Knutson, 2011; Landsea et al., 2010). In a unique study comparing patterns of past observed TC frequency trends and model simulations, Murakami et al. (2020) show that two high-resolution coupled climate models, when forced with observed historical forcings, reproduce the global spatial pattern (a mixture of increases and decreases) over 1980-2018. These simulations suggest that the observed regional increase in TC frequency in the Atlantic basin since 1980 is due, in part, to a recovery from a preceding suppressed period of Atlantic TC frequency, due to increased aerosol forcing. Aerosol forcing increased in the mid-20th century and decreased following the 1980s.
Murakami et al. (2020) also projects a decrease in tropical storm frequency globally and over the Atlantic over the coming century as greenhouse gas influences increasingly dominate over projected aerosol influences. Their finding is notable since their models are the only ones thus far that have demonstrated the capability to simulate the observed pattern of TC frequency change globally since 1980 fairly realistically. Villarini and Vecchi (2012) and Dunstone et al. (2013) also indicate that aerosol forcing was an important, if not dominant, driver of multi-decadal Atlantic hurricane variability, driving a reduction between the 1950s and the 1980s and an increase since the 1990s. These studies imply that trends in tropical cyclone frequency since 1980 cannot be extrapolated to generate predictions of what changes to expect over the coming century due to increasing greenhouse gases.
Future projections
Confidence in future projections depends on the capability of models for simulating the observed climatology of TC behaviour and any observed trend or variability. Confidence also increases when scientific understanding of physical mechanisms for changes is well developed, and if there is a detectable and attributable trend in the TC metric already present in observations.
The proportion of tropical cyclones reaching category 4 & 5 intensity is projected to increase in a warming climate, with a corresponding reduction in the proportion of low-intensity cyclones(Wehner et al., 2015; Bhatia et al., 2018; Vecchi et al., 2019; Knutson et al., 2020). In one study, the annual number of days in which category 4 & 5 storms are projected to occur increases 35% globally by the late 21st century under a medium emissions future scenario (RCP4.5), while the number of category 4 & 5 storms is projected to increase 24% (Knutson et al. 2015), also implying an increase in duration per storm of category 4-5 conditions. Higher-resolution models are better suited for attempting to realistically simulate category 4 & 5 storms (Davis, 2018). Although models used in existing climate change studies are not optimal in that regard, a survey of studies using relatively higher resolution (<28 km grid spacing) models suggests a +10 to +15% increase in the global proportion of these severe cyclones in a +2C warming scenario (Knutson et al., 2020). For comparison purposes, the Knutson et al. (2020) assessment re-scaled the TC projections from many separate studies, which had assumed a mix of future emission scenarios, into a single group of estimates under an assumed +2C global warming scenario.
Although the Knutson et al. (2020) assessment concluded that with medium-to-high confidence the proportion of category 4 & 5 storms relative to all storms would increase with global warming, there was low confidence in how the frequency of category 4 & 5 storms is expected to change, owing to the diversity of projections across available modelling studies. A survey of future projections of category 4 & 5 storm frequency at the basin scale further highlights the uncertainty in the expected sign of change (Knutson et al., 2020).
- The eastern North Pacific shows the largest increase in category 4 & 5 storm frequency among individual basin projections (Knutson et al., 2020).
- In the North Atlantic, category 4 & 5 storms are projected to increase in frequency by a factor of 1.5 to 2.0, depending on emissions scenario, according to one modelling study (Murakami et al., 2018), while a multi-study assessment reported uncertainty in the sign of change projected by different modelling studies (Knutson et al. 2020).
- For the southwest Pacific, most models project a decrease in the frequency of Category 4 & 5 cyclones (Knutson et al., 2020).
For tropical cyclone intensity, a +2C warming scenario is projected to yield a +5% (+1 to +10%) increase in maximum wind speed (Knutson et al., 2020), resulting in greater potential damage per storm. This estimate is consistent with thermodynamic predictions using the potential intensity (PI) theory, which estimates the theoretical maximum intensity of a cyclone within a specific local environment (Emanuel, 1987; Sobel et al., 2016). The presence of only a weak increasing trend in global historical tropical cyclone intensity since 1980 is possibly due to the opposing effect of aerosol cooling (Sobel et al., 2016) on the effect of greenhouse gas-induced warming. However, future greenhouse warming is anticipated to exceed the effects of aerosol cooling on TC intensity, increasing the likelihood of more intense tropical cyclones and rendering the changes more detectable compared to natural variability (Villarini and Vecchi, 2013; Sobel et al., 2016).
Rapid intensification is projected to become more probable over the 21st century (Emanuel 2017; Bhatia et al. 2018), although relatively few studies have examined this metric to date.
Most studies project a decrease in the global frequency of tropical cyclones (tropical storms plus categories 1−5 combined) with warming, albeit with large uncertainty that includes the potential for global increases. The vast majority of climate model studies predict a decrease in the frequency of tropical cyclone activity, or no change (e.g., Mallard et al., 2013; Walsh et al., 2019; Knutson et al., 2015; Murakami et al. 2020), averaging around −14% for +2C of warming in a multi-study assessment (Knutson et al., 2020). There are some exceptions, with two modelling systems predicting increases in overall cyclone frequency (Emanuel, 2013; Bhatia et al., 2018; Vecchi et al., 2019), which reflects differences in the type and detailed formulation of models used. Theoretical explanations of the physical mechanisms to cause a change in cyclone frequency have been a challenging topic (e.g., Vecchi et al., 2019; Hsieh et al., 2020), compounding uncertainty around the model projections (Walsh et al., 2016; Knutson et al., 2020).
- Projections of TC frequency within individual basins are more uncertain, particularly for the central and eastern North Pacific (Walsh et al., 2019). The majority of models project a small decrease but some project increases (Knutson et al., 2020).
- Projections for the southern Indian and southwest Pacific basins show strong agreement among most modelling studies for a reduction in cyclone frequency (Walsh et al., 2016; Knutson et al., 2020). Large natural variability in these regions suggests the projected reductions in at least some models are not statistically significant (Walsh, 2015).
- Reductions are also projected for the North Indian (Mohapatra et al., 2015), tropical Atlantic, and coastal East Pacific basins (Diro et al., 2014).
Some models project changes in locations of storm activity, such as a poleward migration of the latitude of maximum tropical cyclone intensity in the western North Pacific.
- In the western North Pacific, a poleward migration has been observed since the late 1940s. A poleward migration is projected to occur under future warming scenarios in some models (Kossin et al., 2016), further altering the regional tropical cyclone risk. By the late 21st century, under a high future emissions scenario (RCP8.5), the average latitude of storm formation is also projected to have migrated further northwards. According to a modelling study by Lok et al. (2018), the number of tropical cyclones making landfall in south China is projected to decrease, but the average intensity of those that do make landfall is projected to increase.
- In the North Atlantic, future warming under a medium future emissions scenario (CMIP3 SRES- A1B) is projected to result in a reduction of straight moving tropical cyclones, with storm tracks curving to stay over the open ocean instead, according to Colbert et al. (2013). This results in a reduction of −1 to −1.5 cyclones per decade making landfall in the southern Gulf of Mexico, Caribbean, and central America. A similar-sized increase was projected for cyclone landfall over the U.S. mid−Atlantic region (Liu et al., 2017; 2018; Wright et al., 2015).
Future projections of the forward motion (translation speed) of tropical cyclones is uncertain, with different studies projecting both increases and decreases. Future research is required to reach consensus on the impact of human−caused warming on translation speed (Knutson et al., 2020).
- In the Gulf of Mexico, one study projects an increase in summer northward winds and a 10% increase in translation speed, as well as an increase in the rate of tropical cyclone landfall over Texas (Hassanzadeh et al., 2020).
- In the North Atlantic, a high-resolution regional model under a high future emissions scenario (RCP8.5) projected a reduction of translation speed by the late 21st century, compared to recent climate (Gutmann et al., 2018). Another study projected decreasing TC translation speed, but this was projected mainly in Northern Hemisphere midlatitudes, for example, off the east coast of North America, where TCs are typically recurving and accelerating in the westerlies (Zhang et al., 2020).
The rainfall−rate of tropical cyclones is projected to increase with human−caused global warming, and this is expected to exacerbate tropical cyclone flood risk (Wright et al., 2015; Kossin, 2018; Knutson et al., 2015; Liu et al., 2019). In a multi-model assessment of tropical cyclones, under a +2C warming scenario, near-storm rainfall rates are projected to increase globally by an average of +14% (+6 to +22%), with the rainfall rate in many individual basins projected to incur similar increases (Knutson et al., 2020). There is general consistency among models in the sign of this projection, globally and at the basin scale. Projected increases in tropical cyclone rainfall rates match, or slightly exceed, thermodynamic expectations of about 7% per degree Celsius of climate warming (Kodama et al., 2019; Knutson et al., 2015; 2020; Liu et al., 2019). This expectation is based on the Clausius−Clapeyron relation, which implies that a tropical atmospheric column will typically hold about 7% more water vapour per degree Celsius increase of surface temperature. Projected rainfall rate increases in excess of purely thermodynamic expectations may be connected to the projected increase in storm intensity associated with warming (Liu et al. 2019).
- In the North Atlantic, an +8 to +17% increase in rainfall rate was projected for U.S. landfalling tropical cyclones under a medium future emissions scenario (SRES−A1B & RCP4.5) (Wright et al., 2015) and a +24% increase using a high future emissions scenario (RCP8.5) with a high-resolution convection−permitting regional model (Guttman et al., 2018).
- In the western North Pacific, studies have projected a +5 to +7% increase in rainfall rates of typhoons occurring in a warmer climate (Wang et al., 2014; 2015).
Tropical cyclone size changes with climate warming could also be important for future impacts because TC size is an important factor in storm destructiveness. However, model projections of future changes in TC size changes vary across existing studies, leading to low confidence at present in these projections (Knutson et al., 2020).
Storm Surge Impacts
Continued sea level rise will result in more severe storm surge inundation and flooding, all else being equal. Flood risk will likely be further exacerbated by higher tropical cyclone intensities and increased tropical cyclone rainfall rates, while uncertain changes in future tropical cyclone frequency and storm tracks could reduce or further exacerbate these risks. In coastal regions, higher storm inundation levels will be among the greatest potential impacts of future tropical cyclones under climate change, where the combination of likely increased storm intensity and rainfall rates and continued sea level rise will act to increase inundation risk of low−lying, unprotected regions (Walsh et al., 2019; Woodruff et al., 2013; Marsooli et al., 2019; Knutson et al., 2020). However, the net influence of storm frequency change and storm track changes on coastal surge risk is unclear: fewer tropical cyclones may occur, as simulated in the majority of studies, including a possible decrease even in category 4-5 tropical cyclones, as simulated in some studies (Knutson et al., 2020). If such changes materialised, they would act to reduce surge risk, offsetting to some degree the increased risk due to sea level rise and the likely increases in storm intensities and precipitation rates.
- In the North Indian Ocean, one modelling study suggests a possible +20% or +30% increase in storm surge height along the Indian coast, depending on future warming scenario (Rao et al., 2020a; 2020b).
- In the western North Pacific, storm surge levels in the Pearl River Delta region are projected to increase by +8.5% by the late 21st century (2075−2099) under a high future emissions scenario (RCP8.5) (Chen et al., 2020). When combined with sea level rise and local geologic displacement, storm inundation levels may increase by approximately 1m.
- In the North Atlantic, Marsooli et al. (2019) project that the combined effects of sea level rise and tropical cyclone storm surge by the late 21st century (2070−2095), under a high emissions scenario (RCP8.5), will result in the historical 100−year flood level occurring every 1−30 years in the Gulf of Mexico and southeast Atlantic coast, and every year in the mid−Atlantic coast. Little et al. (2015) found that climate models that projected the greatest 21st-century increase in sea level in the North Atlantic also projected the greatest increase in Atlantic hurricane activity, leading to a further increased probability of extreme storm surge outcomes over the 21st century.
- In the New York City region, the downscaling model of Garner et al. (2017) projected that climate change impacts on hurricanes, apart from sea level rise, has little net influence on storm surge risk in the region by 2300, as tropical cyclone tracks shifted away from landfall in the region under climate change, which offset the effect of storm strengthening. Sea level rise acted to increase storm inundation risk, all other factors equal.
This ScienceBrief Review is consistent with findings of the IPCC described in the Special Report on the Oceans and Cryosphere in a Changing Climate (Pörtner et al., 2019). Their findings relating to tropical cyclones are summarised as follows:
“Anthropogenic climate change has increased observed precipitation (medium confidence), winds (low confidence), and extreme sea level events (high confidence) associated with some tropical cyclones, which has increased intensity of multiple extreme events and associated cascading impacts (high confidence).”
“There is emerging evidence for an increase in annual global proportion of Category 4 or 5 tropical cyclones in recent decades (low confidence).”
"Increases in tropical cyclone winds and rainfall, and increases in extreme waves, combined with relative sea level rise, exacerbate extreme sea level events and coastal hazards (high confidence).”
In addition, this review is also consistent with the findings of the WMO Task Team on Tropical Cyclones and Climate Change, as described in two assessment reports, focusing on detection and attribution of past tropical cyclone activity (Knutson et al. 2019) and projections of TC changes with future global warming (Knutson et al., 2020).
The Brief and references since 2013 can be explored at: sciencebrief.org/topics/climate-change-science/cyclones.
Full version in printable format here.
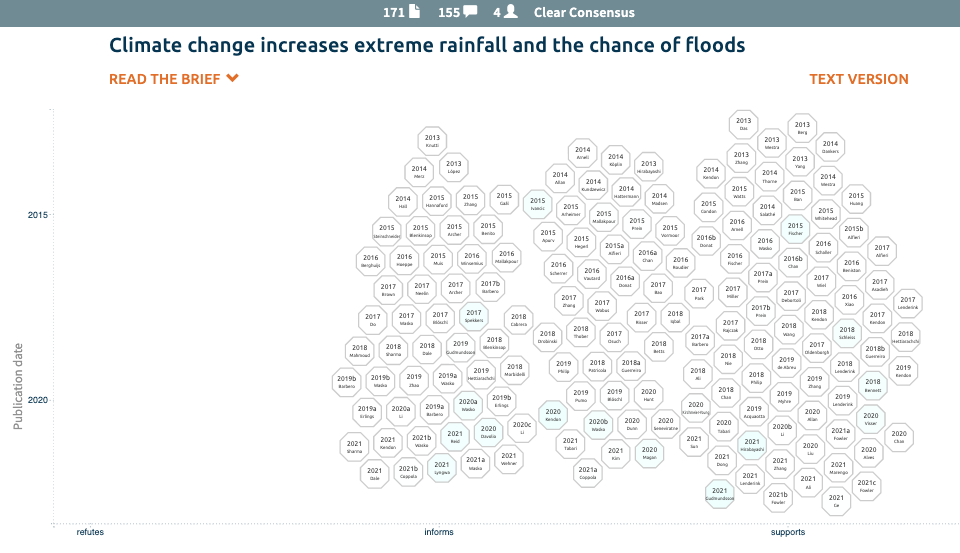
6. Climate change increases extreme rainfall and the chance of floods
- School of Engineering, Newcastle University, Newcastle-upon-Tyne, UK
- Tyndall Centre for Climate Change Research
- Instituto Nacional de Pesquisas Espaciais (INPE), São José de Campos, São Paulo, Brazil
- School of Environmental Sciences, University of East Anglia (UEA), Norwich, UK
Full version in printable format here.
This ScienceBrief Review is part of a collection on Critical Issues in Climate Change Science, relevant to inform the COP26 climate conference to be held in Glasgow (2021). Eds: Corinne Le Quéré, Peter Liss, Piers Forster.
Approach. This ScienceBrief Review examines the links between climate change and extreme rainfall that can lead to severe flooding. It synthesises findings from more than 170 peer-reviewed scientific articles gathered using ScienceBrief. The Brief and evidence can be explored at: https://sciencebrief.org/topics/climate-change-science/extreme-rainfall-and-climate-change.
Summary. Climate change increases the frequency and intensity of extreme rainfall because a warmer atmosphere holds more water vapour that can rain out, sometimes over a short period. The movement of water vapour through the atmosphere, in storms, is also modified. Increases in extreme rainfall have been observed in many parts of the world. Extreme rainfall, in turn, can increase the chance of floods occurring and their magnitude in small and in urban catchments, severely impacting local populations and infrastructure. Extreme rainfall and associated flood hazards are projected to increase as global temperatures continue to rise.
Key Points
The evidence shows clear consensus that climate change is causing an increase in the intensity of extreme rainfall. While economic losses from floods have risen due to socioeconomic and demographic factors (Hoeppe, 2016), observations suggest peak river flows (used as an indicator of potential floods) have decreased in most rural catchments (Wasko & Sharma, 2017) but increased in small and/or urban ones (Sharma et al., 2018). Future projections suggest that much of the world will experience enhanced rainfall extremes and risk of flooding with ongoing climate change (Arnell & Gosling, 2016; Alfieri et al., 2017; Tabari 2021). Efforts to limit warming to +1.5 °C will help limit changes in extreme rainfall, whilst further societal adaptations will be needed to minimise the impact.
- Extreme rainfall intensifies with rising dew point temperature at a rate of around +6% to +7% per °C, in line with theoretical expectations from thermodynamics, known as Clausius-Clapeyron scaling (Ali et al., 2018, 2021).
- In many regions, including Australia, Europe, North America and Asia, extreme sub-daily rainfall intensifies with surface air temperature at greater than Clausius-Clapeyron scaling for localised regions, due to convective feedbacks from clouds and changes in atmospheric circulation resulting in increased moisture being drawn in to storms (Lenderink et al., 2017; 2021). When averaged over large regions, scaling is around Clausius-Clapeyron (Ali, 2021).
- Some extreme rainfall and storm events have been demonstrated to be somewhat more likely to occur due to climate change in examples from the UK, France, Louisiana, and southern South America.
- Observations of high river flows vary regionally but trends are decreasing in the majority of rural catchments and increasing in urban catchments, highlighting the complex interplay of processes that control flooding.
- In recent years, very high resolution climate models have brought much improved representations of extreme rainfall intensity (Prein et al., 2015; Kendon et al., 2017), which suggest extreme rainfall will become more intense with continued future warming (Kendon et al., 2014; 2017; 2019).
- Future increases in rainfall intensity, projected by theory and modelling, may result in clearer flooding trends, though much more extensive river flow observations will be required for detection, especially for rapid, flash floods (Fowler et al., 2021a).
Background. Extreme rainfall events result in significant societal impacts, including flooding and landslides, leading to major socioeconomic damages (Debortoli et al., 2017; Spekkers et al., 2017). Assessment in the IPCC special report on global warming of 1.5 °C noted a likely increase in frequency, intensity and/or amount of extreme rainfall in several regions. However, predicting the response of future rainfall rates to climate change is less certain than predicting future temperature (Knutti and Sedlácek, 2013). Modelled rainfall variability across daily to decadal timescales is projected to increase, on average, and several regions, including in south and east Asia, northern Australia and Brazil, are projected to experience both drier or more frequent dry periods and wetter wet periods (Brown et al., 2017; Alves et al., 2020).
This review focuses on the response of extreme rainfall, representing the highest intensity portion of total rainfall, to climate change. Extreme rainfall is often defined by the 99th percentile, referring to the most intense 1% of rainfall, or alternatively the annual maxima, the highest total in a year, typically over 24 hours. It is possible for increases in extreme rainfall intensity to occur during a background reduction in total rainfall, if there is a reduction in low-medium intensity rainfall (Ban et al., 2015; Tabari, 2020).
Theory
It is well established that the frequency and intensity of extreme rainfall increases more strongly with global mean surface temperature than does mean rainfall (Berg et al., 2013; Myhre et al., 2019) as the latter is limited by evaporation, whilst changes in extremes are also affected by local in-storm processes. In simple terms, warmer air can hold more water vapour that can subsequently fall as rain. For each degree of warming, the air’s capacity for atmospheric water vapour increases at about +6% to +7% per degree of warming, assuming other atmospheric conditions remain roughly constant, known as Clausius-Clapeyron scaling (Allan et al., 2014). A warming atmosphere with more moisture can therefore produce more intense rainfall events, with this scaling providing a first approximation (Fowler et al., 2021a). A wide range of other processes are also important in driving changes in extreme rainfall, including atmospheric circulation patterns, sea surface temperature and large-scale atmospheric circulation systems such as the El Niño-Southern Oscillation (ENSO), changes to land cover or land use, and atmospheric aerosol concentration.
Scaling rates around Clausius-Clapeyron have been observed between day-to-day temperature variability and daily rainfall extremes (Ali et al., 2018) but sub-daily extreme rainfall intensity can exceed Clausius-Clapeyron scaling, reaching as much as double (+10% to +14% per °C) (Lenderink et al., 2017; Park et al., 2017; Zhang et al., 2017; Ali et al., 2021). This relationship is not uniform, and intensities sometimes rise at a lower rate at higher temperatures (Chan et al., 2016a; Park et al., 2017; Zhang et al., 2017; Drobinski et al., 2018) and is constrained by moisture availability (Park et al., 2017; Prein et al., 2017a; Zhang et al., 2017), and can potentially vary due to large-scale atmospheric conditions (Blenkinsop et al., 2015; Magan et al., 2020) and seasonality (Fowler et al., 2021a). The enhanced scaling relationship for sub-daily extremes could relate to local factors like storm size (Fowler et al., 2021a), a combination of convective cloud feedbacks, and changes to large-scale atmospheric circulation (Lenderink et al., 2017; Fowler et al., 2021a; 2021b), whilst local-scale increases and large-scale decreases in the instability of the atmosphere could have confounding effects (Fowler et al., 2021a). The impact of moisture availability is particularly important as local circulation changes, due to convection, can draw moisture into storm centres. Dew point temperature, which relates closely to relative humidity, has therefore proved to be a more consistent metric for estimating the scaling of extreme rainfall than near-surface air temperature (Lenderink et al., 2017; Barbero et al., 2017a; Ali et al., 2018). This scaling is consistently around the Clausius-Clapeyron rate when averaged over most regions with higher scaling only observed at local scales (Ali et al., 2021). However, more consistent results with near-surface air temperature have been obtained using data that resolve within-day temperature variations and better reflect prevailing storm conditions (Schleiss, 2018; Visser et al., 2020). It is not yet clear whether future rainfall change with warming will be consistent with these rates although climate models are starting to provide such evidence (Lenderink et al., 2021).
Observations
Increases in daily extreme rainfall rates have been observed globally and on continental scales through the 20th and early 21st centuries concurrent with rising average surface temperature. Studies of daily precipitation overwhelmingly indicate that extremes have generally become more frequent and more intense globally over the past century (Westra et al., 2013; Donat et al., 2016a; Dunn et al., 2020; Dong et al., 2021; Sun et al., 2021) whilst more detailed studies have indicated similar results on continental scales (Dong et al., 2021; Sun et al., 2021) including over both dry and wet regions (Donat et al., 2016b). Continental scale increases in the frequency of daily extremes over Europe and the United States (Fischer & Knutti, 2016) and in their frequency and intensity over Australia (Guerreiro et al., 2018b) are consistent with theory. Increases in frequency of occurrence have been noted to be greatest for the most extreme events, as highlighted by the IPCC Third Assessment Report, whilst similar behaviour over large domains is also noted by Myhre et al. (2019). However, patterns of change vary on regional scales, the clearest increasing trends are for northern Europe and central Eurasia whilst there remains a lack of long data records over Africa, the Amazon region, and parts of southeast Asia (Donat et al., 2016a).
Lack of sufficiently long records in many areas has prevented robust statements on global changes in short-duration (e.g. hourly) rainfall extremes but increases have been detected in several regions including the United States and parts of Europe, southeast Asia, India and Australia (Fowler, 2021a). Increases in the frequency and intensity of hourly rainfall extremes have been found to exceed those of daily extremes in Australia (Guerreiro et al., 2018b). Results from high resolution climate models have corroborated the observed trends over the United States (Prein et al., 2017a).
Observations from a broad range of latitudes and environments have demonstrated an increase in daily extreme rainfall intensity of around +6% to +7% per degree of warming of surface air temperature, matching expectations in accordance with Clausius-Clapeyron scaling and climate model simulations (Westra et al., 2013; Fischer & Knutti, 2016; Scherre et al., 2016). Guerreiro et al. (2018b) detected observed continental-scale increases in hourly rainfall intensity and frequency for Australia at up to 2-3 times Clausius-Clapeyron scaling.
In most catchments, trends in high river flows are decreasing despite rising temperatures and increasing rainfall extremes (Wasko & Sharma, 2017; Wasko et al., 2019). Most studies of changes in floods have considered extremes in river flow data at daily timescales or longer and although they identify regional consistencies in the direction of trends (Do et al., 2017; Gudmundsson et al., 2019), globally more stations show significant decreasing than significant increasing trends. This is not consistent with the hypothesis that the increases in extreme rainfall (driven by increases in temperature) will drive increases int flood hazard globally. Some regional increases have been observed (Mallakpour & Villarini, 2015; Blöschl et al., 2019), for small catchments (Do et al., 2017) and urban catchments (Sharma et al., 2018) where the effects of moisture in the soil are small and floods are primarily driven by rainfall intensities (Ivancic & Shaw, 2015) that exceed drainage capacity. Possible increases have also been found for the rarest, most extreme floods (Wasko & Nathan, 2019). Whilst it is commonly assumed that increased global flood hazard may result from increases in extreme rainfall, flooding is influenced by a range of factors, summarised in Table 1, with soil moisture (evaporation) or snowmelt often the most influential (Gaál et al., 2015; Berghuijs et al., 2016; Sharma et al., 2018; Hettiarachchi et al., 2019; Wasko & Nathan, 2019). The lack of correspondence between these trends in high river flows and increased financial cost of floods points to concurrent increases in exposure and vulnerability to flood hazards (Do. et al., 2017). Furthermore, changes in the timing of high flows have been detected and may be associated with significant impacts (Blöschl et al., 2017; Wasko et al., 2020).
Flash flooding in urban areas has likely increased in recent decades, due to the expanding impermeable landscape increasing surface runoff, and increases in the intensity of short-duration extreme rainfall (Acquaotta et al., 2019). Flooding of small river catchments that respond rapidly to rainfall, and urban catchments where the soil moisture storage is less important, provides a more direct link between temperature, rainfall intensity and flooding. Therefore flooding in these catchments might be expected to rise due to extreme rainfall intensification as temperatures rise (Sharma et al., 2018). However, the role of extreme rainfall in these floods is difficult to isolate from the effects of urbanisation, which may itself lead to local increases in rainfall intensity (Li et al., 2020), and this is made more challenging by the sparsity of sub-daily river flow records (Fowler et al., 2021a). Inadequate drainage infrastructure that struggles to handle the increasing magnitude of extreme rainfall, may also contribute to urban flash flooding (Xiao et al., 2016).
Extreme rainfall attribution
Despite large natural variability, the influence of human activity on observed increases in extreme daily rainfall has been identified globally, on continental scales (Dong et al., 2021), and regionally in the case of North America (Kirchmeier-Young & Zhang, 2020). A study of Australian rainfall observations found increases to hourly extreme rainfall were in excess of that which could be explained by natural variations, such as the El Niño-Southern Oscillation (ENSO) or seasonality (Guerreiro et al., 2018b). Human influence was detected in the extremely wet winter of 2013/2014 in the UK (Vautard et al., 2016). A quantified increase in the likelihood of individual storms or flooding events, due to human influence, has been calculated for numerous examples including: three UK storms in December 2015, which are estimated to have collectively been +59% more likely (Otto et al., 2018). Flooding of the Seine and Loire rivers in central and northern France in May-June 2016, is estimated to have resulted from extreme rainfall that was +2.2 and +1.9 times more likely, respectively (Sjoukje et al., 2018). In south Louisiana, extreme rainfall in August 2016 was made more likely by a factor of +1.4 compared to 1900 (van der Wiel et al., 2017). In April–May 2017, extreme rainfall in the Uruguay River basin, Southern South America, was made more likely by a factor of almost five (de Abreu et al., 2019). Climate change attribution in extreme rainfall associated with hurricanes and tropical cyclones is discussed in a separate ScienceBrief Review of tropical cyclones.
Future projections
Relatively coarse-scale global climate models show future increases in daily rainfall extremes over most land regions with warming (Seneviratne & Hauser, 2020; Coppola et al., 2021a). Regional studies using global models and more detailed regional climate models show a similar picture (e.g. Ge et al, 2021, Coppola et al 2021b, Kim et al, 2021) although there remains uncertainty on the magnitude of change at regional scales. Regional climate model performance improvements project increased extreme rainfall over the La Plata basin in South America, the Congo basin in Africa, east North America, north east Europe, India and Indochina regions, while less detailed global models show weak or negligible trends (Coppola et al., 2021a).
In recent years, very high resolution climate models have brought much improved representations of extreme rainfall intensity (Prein et al., 2015; Kendon et al., 2017). Historically, climate models have not accurately captured extreme rainfall intensity, due to their resolution being too coarse to reproduce small-scale (1-10km2) clouds and other processes that control rainfall (Kendon et al., 2017; Zhang et al., 2017). Convection-permitting models (CPMs) can produce regional-scale simulations at a resolution of ≤4km, enabling storm processes such as cloud convection and local feedbacks to be simulated within the model, rather than using parameterisation (inputting generalised values). They are also able to capture more detailed local surface features like mountains (Ban et al., 2015). CPMs have now been run over many regions (Fowler et al., 2021b) but are yet to be run globally, because of their high level of detail. Ground-breaking CPM experiments over the UK point to more intense hourly rainfall extremes with future warming (Kendon et al., 2014; Chan et al., 2018) and this advance in modelling is now incorporated in the national UK Climate Projections using multiple model simulations (Kendon et al., 2020). Elsewhere, CPMs also point to more intense storms with climate warming over Europe (Lenderink et al. 2019; Chan et al., 2020), the US (Prein et al., 2017a,b) and Africa (Kendon et al., 2019). Future understanding of potential changes in flood risk will also require an understanding of how the total volume of rainfall in a storm will change and CPMs offer the potential to be used alongside rainfall observations to understand how storm size and duration might change (Wasko et al., 2016; Prein et al., 2017b; Lochbihler et al., 2017). Despite their limitations, such as producing heavy rainfall that tends to be too intense, and difficulty in quantifying future uncertainties, the ability of these models to project future changes in extreme rainfall is a significant advance (Kendon et al., 2021) and is providing confidence in future projections of more intense sub-daily rainfall (Prein et al.,2015; Kendon et al., 2017).
Projected increases in extreme rainfall intensity drive an increase in flooding in small and/or urban catchments (Kendon et al., 2018), with flash flooding projected to increase in at least the U.K. (Miller & Hutchins, 2017), Egypt (Mahmoud et al., 2018), Indonesia (Muis et al., 2015), Brazil (Marengo et al., 2020), and China (Xiao et al., 2016). However, many other factors control flooding (see Table 1), and these may compensate for increases in extreme rainfall. If all factors remain constant, increased extreme rainfall would result in increased flooding; however, it is likely climate change also varies some of these other factors (Sharma et al., 2018).
Significant uncertainty remains when attempting to translate projected increases in extreme rainfall to an overall increase in flood hazard (Fowler et al., 2021a; Wasko, 2021a). There has been little research directly translating projected changes in extreme rainfall through hydrological models to estimate changes in flood frequency (Hirabayashi et al., 2021). Although future warming points to increases in rainfall intensities and the scaling relationship between temperature and the most extreme flows could inform some future changes in flooding (Wasko, 2021a), projections of these changes will also need to account for changes in other factors (see Table 1). Climate change may also alter the structure of storms so they become bigger (Prein et al., 2017b) or longer in duration (Chan et al., 2016), increasing the volume of rain falling over a location. Further research is needed to fully understand how such changes might affect flooding and the need for societies to adapt.
This ScienceBrief Review is consistent with the IPCC Special Report on 1.5 degrees (2018) Chapter 3 and Special Report on Climate Change and Land (2019) Chapter 4, both of which noted that human-induced global warming has already caused observed increases in frequency, intensity and/or amount of extreme rainfall in several regions. Furthermore, this review is consistent with the findings reported in the discussion meeting issue of the Royal Society ‘Intensification of short-duration rainfall extremes and implications for flash flood risks’ (2021).
The full Brief and references can be explored on ScienceBrief with the following link: https://sciencebrief.org/topics/climate-change-science/extreme-rainfall-and-climate-change.
Full version in printable format here.
7. Climate change increases marine heatwaves harming marine ecosystems

- UWA Oceans Institute and School of Biological Sciences, University of Western Australia (UWA), Australia.
- Institute of Marine Research, His 4817, Norway.
- Marine Biological Association of the United Kingdom, The Laboratory, Citadel Hill, Plymouth, UK.
- Climate and Environmental Physics, Physics Institute, University of Bern, Bern, Switzerland.
- Oeschger Centre for Climate Change Research, University of Bern, Bern, Switzerland.
- School of Environmetnal Sciences and Tyndall Centre for Climate Change Research, University of East Anglia (UEA), Norwich, UK.
Full Full version in printable format here.
This ScienceBrief Review is part of a collection on Critical Issues in Climate Change Science, prepared for the COP26 climate conference to be held in Glasgow (2021). Eds: Peter Liss, Corinne Le Quéré, Piers Forster.
Approach. This ScienceBrief Review examines the links between climate change and marine heatwaves. It synthesises findings from more than 110 peer-reviewed scientific articles gathered using ScienceBrief. The Brief and evidence can be explored at: https://sciencebrief.org/topics/climate-change-science/marine-heatwaves.
Summary. Climate change has contributed to observed increases in the frequency, intensity and duration of marine heatwaves over recent decades. Climate models have shown that recent marine heatwaves in all oceans have been longer and more intense than can be explained by natural variability alone. These changes have caused widespread impacts on marine species with changes in distribution, loss of biodiversity, collapse of foundation species including coral, kelp and seagrass and the ecosystems they support, and declines in fisheries and cultural values. Ongoing climate change will lead to additional increases in marine heatwave frequency and intensity, further threatening marine life and the ecosystem services they provide to human societies.
Key points
The evidence shows clear consensus that human-caused climate change is causing an increase in the frequency, intensity and duration of marine heatwaves and associated impacts.
- Marine heatwaves, when defined as the daily sea surface temperature exceeding the local 99th percentile, have doubled in frequency between 1982-2016 (Frölicher et al., 2018; Collins et al., 2019) and are projected to increase further with future climate change (Frölicher et al., 2018, Oliver et al. 2019b).
- 84 to 90% of all marine heatwaves occurring between 1986-2005 have been attributed to human-caused climate change (Frölicher et al., 2018), while the likelihood of seven recent, high impact marine heatwaves increased more than 20-fold due to human-caused climate change (Laufkötter et al., 2020). It is almost impossible that the Northeast Pacific 2013-2015 marine heatwave (often called ‘the Blob’) would have occurred without human-caused global warming (Laufkötter et al., 2020).
- The ecological and socioeconomic impacts of marine heatwaves are widespread, impacting all oceans and a range of species throughout entire ecosystems. Impacts include changes to species geographic ranges and primary productivity, mass mortality, mass bleaching of coral, loss of biodiversity, declines in fisheries revenues and livelihoods, and degradation of cultural and recreational assets (Hughes et al., 2017; Smale et al. 2019; Cheung et al. 2021; Smith et al., 2021).
- Future marine heatwaves are projected to become more frequent, intense and longer by the mid-21st century under all future emissions scenarios (including those aligned with the Paris Agreement), while larger increases from high emission scenarios are projected to develop during the second half of the century (Frölicher et al., 2018; Darmaraki et al., 2019, Oliver et al. 2019b).
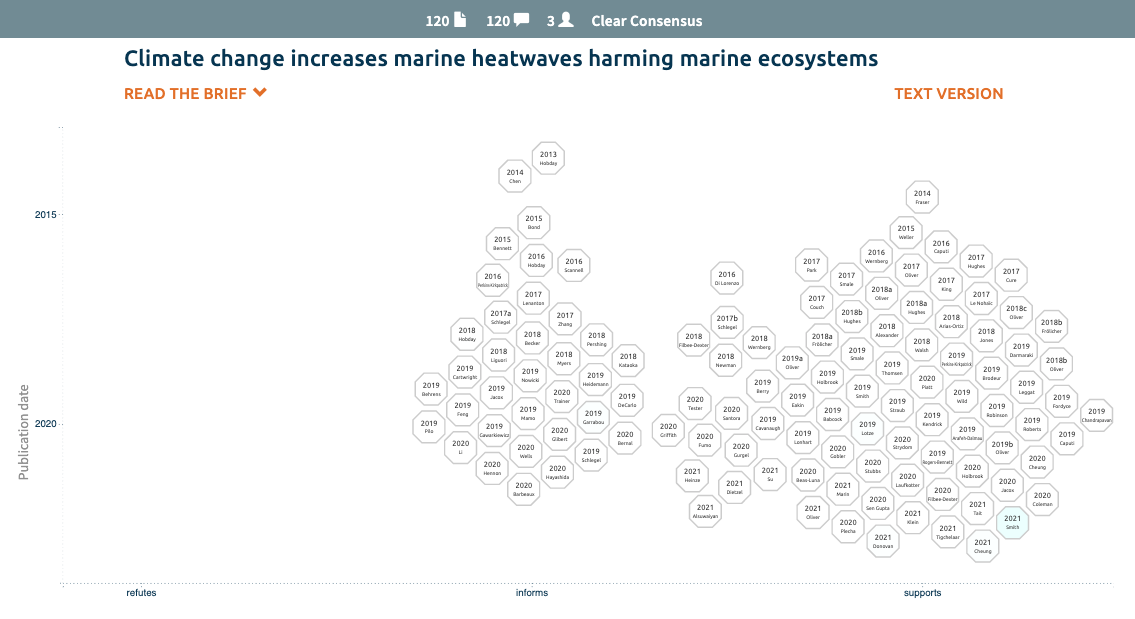
Background. In contrast to atmospheric heatwaves, extreme temperature events that occur in the marine environment have only become the focus of significant research in the last decade, with the exception of studies on the impacts of marine heatwaves on warm water corals (e.g. Hughes et al., 2003). A 2011 extreme marine heatwave in the southeastern Indian Ocean, off Western Australia (see Box 1), initiated a wealth of new studies into the causes and impacts of marine heatwaves. Coral bleaching of the Great Barrier Reef (Hughes et al., 2018a) and other locations, is just one impact of marine heatwaves with a visible public profile. Yet extreme warming events impact a wide range of species, altering ecosystem function and provision of ecosystem services (Wernberg et al., 2016, 2018; Smale et al., 2019, Holbrook et al., 2020, Smith et al. 2021), cause mass mortality (Jones et al., 2018; Roberts et al., 2019; Piatt et al., 2020), and may also result in socioeconomic impacts to tourism and fishing (Caputi et al., 2016; Barbeaux et al., 2020; Cheung et al., 2020, 2021; Holbrook et al., 2020; Smith et al. 2021).
Marine heatwaves are often defined as anomalously warm water events of 5 days or more in duration, during which temperatures exceed the 90th percentile of locally observed long-term (i.e. 30-year) averages for a location and time (Hobday et al., 2016; Oliver et al., 2021). Though other definitions are also used. Categories I (moderate), II (strong), III (severe) and IV (extreme) are sometimes used to describe the intensity of a marine heatwave, based on multiples of the difference between the local mean and 90th percentile values (Hobday et al., 2018).
Observations
Marine heatwaves are caused by a range of natural physical processes driven by oceanic and atmospheric conditions, but ocean warming due to human-caused climate change increases the probability of these processes combining to produce more frequent and intense heatwaves (Oliver et al., 2018c, 2021; Holbrook et al., 2019). Marine heatwaves may arise from a combination of local and remote processes. Local processes include air-sea heat exchange, advection by mean currents and eddies, and vertical and horizontal mixing including diffusion (Oliver et al. 2021). These local processes can be modified by climate modes (patterns of large-scale oceanic or atmospheric circulation) cycling between their positive and negative phases, over periods ranging from weeks to decades (Holbrook et al., 2019, 2020). El Niño events, for example, are statistically linked to stronger marine heatwaves in the Pacific Ocean, as well as parts of the Indian Ocean, Southern Ocean and east Atlantic Ocean (Holbrook et al., 2019).
The observed global average frequency of marine heatwaves has doubled between 1982-2016 (Frölicher et al. 2018). The duration, extent and intensity of marine heatwaves has also increased over the last 4 decades, with evidence of increases to some metrics over longer records (Frölicher et al., 2018, Oliver et al., 2018c). Compared to the early 20th century, the average number of marine heatwave days (*defined below) over the 1982-2016 satellite period, increased +54%, with an average +34% increase in frequency, and average +17% increase in duration, based on the combination of proxy metrics, station data and satellite records (Oliver et al., 2018c).
Marine heatwave frequency is between 1 and 3 annual events for most of the global ocean and this increased, on average, by +0.45 annual events per decade, during the satellite era, which is equivalent to +1.6 annual events or +5 marine heatwave days (Oliver et al., 2018c). The largest increases were in the high latitude North Atlantic (>50°N) and these were partly offset by decreases in the Southern Ocean (>50°S) (Oliver et al., 2018c).
- Marine heatwave duration is variable across the global ocean (Oliver et al., 2018c), with the longest recorded events being between 40 and 160 days for 80% of the ocean and exceeding 250 days in the El Niño-impacted tropical eastern Pacific (Sen Gupta et al., 2020). In the northeast Pacific the average duration is 30 days (Oliver et al., 2018c; Holbrook et al., 2019), with maximum duration exceeding 200 days (Sen Gupta et al., 2020). Comparing 2000-2016 with 1982-1998, average marine heatwave duration increased for 84% of the global ocean, increasing at +1.3 days per decade, since 1982 (Oliver et al., 2018c).
- Marine heatwave intensity anomaly peaks were typically between +2.5oC and +3.7oC but peaks exceeding +5 oC were observed in over 5% of the global ocean, including in the tropical eastern Pacific, northern Atlantic, northern Pacific and southern Indian oceans (Sen Gupta et al., 2020). Comparing the period 2000-2016 with 1982-1998, marine heatwave intensity increased for 65% of the global ocean (Oliver et al., 2018c). Over the period 1982-2016, marine heatwave (here defined with a local 99th percentile threshold) intensity has increased by +0.07°C (-0.01°C to 0.15°C) per decade (Frölicher et al. 2018).
Ecosystem Disturbance
Coral bleaching events have occurred at tropical reefs globally, with increased frequency over recent decades as the frequency of marine heatwaves has risen (Hughes et al., 2018b; Leggat et al., 2019). Persistent or severe bleaching or heat stress leads to cellular damage, reef structure change and coral mortality, which then leads to reef fish and invertebrate species mortality as habitat is lost (Fordyce et al., 2019; Robinson et al., 2019). The global average interval between coral bleaching events has reduced by around half since 1980 and is now only 6 years, which limits the likelihood of reef systems recovering between events (Hughes et al., 2017, 2018b, Eakin et al., 2019). Multiple bleaching episodes occurred during the global-scale 2014-2017 mass bleaching event (Eakin et al., 2019) and the unprecedented severity and scale of heat stress caused significant mortality and reduction of coral habitat in Hawaii (Couch et al., 2017), all around Australia (Nohaïc et al., 2017; Hughes et al., 2017, 2018a; Eakin et al., 2019, Dietzel et al., 2021), central and western Pacific islands (Eakin et al., 2019). Marine heatwaves have also resulted in declines of non-reef building coral invertebrates and soft corals in the Mediterranean (Garrabou et al., 2019).
Kelp forest collapse and transition to degraded turf seascapes have been associated with warming and marine heatwaves worldwide (Filbee-Dexter & Wernberg 2018), including both sides of the North Atlantic (Filbee-Dexter et al., 2020), the Pacific Ocean around Baja California (Arafeh-Dalmur et al., 2019; Cavanaugh et al., 2019) and British Columbia (Rogers-Bennett et al., 2019) and New Zealand (Thomsen et al., 2019; Tait et al., 2021) and the Indian Ocean around Western Australia (Wernberg et al., 2013, 2016). Kelp forests provide habitat and food for a wide variety of fish and invertebrate species, so their loss can impact entire ecosystems, as well as limiting provision of ecosystem goods and services to humans, including fishing, recreation & tourism, and carbon storage (Filbee -Dexter & Wernberg 2018). In contrast, turf algae form simpler matt-like environments offering less ecosystem support (Filbee -Dexter & Wernberg 2018). The widespread distribution of changes and absence of observed recovery may be indicative of tipping points being reached, bringing regime change from kelp-dominated to turf-dominated coastlines (Filbee-Dexter & Wernberg 2018) or sea urchin barrens (Rogers-Bennett & Catton, 2019). The correlation of kelp forest collapse with warming hotspots (Filbee-Dexter et al., 2020) suggests the primary role of marine heatwaves above any compounding or secondary factors (Filbee-Dexter & Wernberg 2018; Babcock et al., 2019; Rogers-Bennett & Catton, 2019; Tait et al., 2021).
Sea grasses are another foundation species that have been negatively impacted by marine heatwaves and the larger marine organisms they support, including turtles, dugong and birds, through provision of ecosystem services such as food and habitat, have also been impacted (Babcock et al., 2019; Kendrick et al., 2019; Strydom et al., 2020). Carbon storage is another ecosystem service provided by seagrass meadows (Nowicki et al., 2019) that will be reduced by seagrass meadow contraction. Extensive (-36%) loss of seagrass in Shark Bay, Western Australia, following the 2011 marine heatwave, is estimated to have reduced marine sediment carbon stocks between -2 and -9 Tg CO2, contributing +4% to +21% to Australia’s land-use change CO2 emissions (Arias-Ortiz, et al., 2018).
Marine heatwaves can cause ecosystem-level decline by reducing biomass of other primary producers, such as phytoplankton and zooplankton communities, which reduces food supply to foraging fish while simultaneously increasing their metabolic food demand, leading to starvation (Piatt et al., 2020). Consequently, declines in health (e.g. malnutrition), increased reproductive failures, or increased mortality were observed in ground fish, as well as large predatory fish, sea birds and mammals that feed on foraging fish (Piatt et al., 2020).
Attribution
A growing number of studies have quantified an increase in probability or intensity of marine heatwaves as a result of human-caused climate change, in addition to natural processes (Park et al., 2017; Walsh et al., 2018; Oliver et al., 2018a, 2021; Perkins- Kirkpatrick et al., 2019; Laufkötter et al. 2020). For example, a 5-fold increase in probability of the 2014 western North Pacific marine heatwave (Weller et al., 2015), and a >6-fold increase in intensity of the 2015/16 Tasman Sea marine heatwave (Oliver et al., 2017). Globally, it is estimated that 84-90% of all marine heatwaves that occurred between 1986 and 2005 are attributable to human-caused climate change (Frölicher et al., 2018). Collectively, the occurrence probabilities of the duration, intensity and cumulative intensity of the seven most severe and well documented marine heatwaves to have occurred recently, are estimated to have increased at least 20-fold due to human-caused climate change (Laufkötter et al., 2020).
Rising mean sea surface temperature is the dominant driver of increasing marine heatwave frequency and intensity, outweighing changes due to temperature variability (Alexander et al., 2018; Frölicher et al. 2018, Oliver, 2019a). Analysis indicates rising mean temperature led to higher marine heatwave frequency over two-thirds, and higher intensity over one-third, of the global ocean (Oliver, 2019a). Mean sea surface temperature is rising over most of the global ocean, while variability changes are concentrated in certain hotspots, such as western boundary currents, the equatorial eastern Pacific and Mediterranean Sea (Hobday & Pecl 2014, Oliver, 2019a). Prominent marine heatwaves commonly occur where mean warming and higher variability overlap, increasing cumulative intensity, such as in the northwest Atlantic, Mediterranean Sea, Tasman Sea and Japan Sea (Oliver, 2019a).
Future Projections
Marine heatwaves are projected to continue increasing in frequency, duration and intensity under future scenarios of climate change, raising the threat to marine ecosystems and socioeconomic activities that depend upon them (Frölicher et al., 2018, Frölicher & Laufkötter, 2018; Oliver et al., 2019a, 2019b). While the extent of future impacts is dependent upon the particular greenhouse gas emission scenario, a worsening outlook is projected for marine ecosystems in all future scenarios. At +1.5oC of future warming, marine heatwaves that occurred with centennial to millennial frequency in a pre-industrial climate, such as the Northeast Pacific 2013-2015 marine heatwave, are projected to occur with decadal to centennial frequency (Laufkötter et al., 2020). The outlook worsens for higher future emissions and warming scenarios (King et al., 2017; Frölicher et al. 2018; Oliver et al., 2019b). At +3.5°C of future warming relative to preindustrial levels, the number of marine heatwave days is projected to increase by a factor of at least 40. At this level of warming, marine heatwaves reach intensities of +2.5°C and have a spatial extent that is 21 times bigger than preindustrial levels (Frölicher et al. 2018). Under high future emissions, by the late 21st century, much of the global ocean may reach a permanent state of marine heatwave, relative to a fixed preindustrial threshold (Oliver et al., 2019b).
Ecosystem disturbance
The projected rise in marine heatwave frequency, duration and intensity will have an increased impact on marine ecosystems, particularly species with reduced mobility, including foundation species such as coral, kelp and seagrasses (Smale et al. 2019) and populations of species that live near the upper limit of their thermal tolerance (Collins et al., 2019). Despite some species showing greater resilience to marine heatwaves, widespread species mortality and the decline of ecosystems are possible future outcomes (Straub et al., 2019). In the northwest Pacific Ocean, by 2050 under a high future emissions scenario (RCP8.5), future marine heatwaves are projected to double the magnitude of the impact of long-term changes to mean climate on fish stocks, particularly in terms of reduced biomass, which will impact the fishing industry (Cheung et al., 2020). In the Indian ocean off Western Australia, a four-fold increase in marine heatwave frequency is projected to reduce the reproductive output of green turtles by -20%, while also reducing food availability (Stubbs et al., 2020).
Marine heatwaves will amplify reductions in fish stocks and food availability, already predicted due to long-term climate change. The global average impact of marine heatwaves on future fish stocks is projected to be a reduction in biomass of 77% of fish and invertebrate species targeted by fisheries and a -6% reduction (range = -1% to -22%) in maximum catch potential under a high emissions (RCP8.5) scenario (Cheung et al., 2021). These changes in biomass and fish catch due to marine heatwaves will be in addition to the projected climate change-induced long-term changes in fisheries catch and biomass by 2050, (Bindoff et al., 2019; Lotze et al. 2019). The increased frequency of marine heatwaves will further reduce future food supply, revenue and employment in the majority of maritime countries, especially those most susceptible to future climate change and with high dependency on wild-capture fisheries, such as Small Island Developing States, countries in southeast Asia and Africa (Cheung et al., 2021; Tigchelaar et al., 2021).
This ScienceBrief Review is consistent with the IPCC Sixth Assessment Reports (AR6 WG1) Chapter 9.2 (2021) and Special Report on the Ocean and Cryosphere in a Changing Climate Chapter 6.4, which assessed with high confidence* that the observed increasing occurrence of marine heatwaves with rising frequency, intensity and duration, are very likely* the result of human-caused climate change. Future increases in magnitude are also assessed as very likely*, varying by future emissions scenario and region, and yielding severe and persistent impacts on marine ecosystems.
*See an explanation of IPCC calibrated language.
The Brief and references can be explored on ScienceBrief here: https://sciencebrief.org/topics/climate-change-science/marine-heatwaves.
Full version in printable format here.
8. Arctic warming amplifies climate change and its impacts
- School of Environmetnal Sciences and Tyndall Centre for Climate Change Research, University of East Anglia (UEA), Norwich, UK.
- Met Office Hadley Centre, FitzRoy Road, Exeter, UK.
- Atmospheric and Environmental Research, Inc., Lexington, MA, USA.
- Department of Civil and Environmental Engineering, Massachusetts Institute of Technology, Cambridge, MA, USA.
Full version in printable format is available here.
This ScienceBrief Review is part of a collection on Critical Issues in Climate Change Science, prepared for the COP26 climate conference in Glasgow (2021). Eds: Peter Liss, Corinne Le Quéré, Piers Forster.
Approach. This ScienceBrief Review examines the evidence linking Arctic warming to the amplification of climate change impacts in Arctic, boreal and mid-latitude regions. It synthesises findings from more than 190 peer-reviewed scientific articles gathered using ScienceBrief. The Brief and evidence can be explored at: https://sciencebrief.org/topics/climate-change-science/arctic.
Summary. The Arctic region has warmed at least twice as much as the global average, leading to a number of environmental consequences. The extent and thickness of sea-ice have decreased and rates of permafrost thaw have increased in recent decades. The impacts of rising mean annual temperatures have been exacerbated by an increase in heatwaves this century. These changes amplify climate change and its impacts. Wildfires are releasing greenhouse gases, while the loss of sea ice is reducing the amount of solar energy reflected by the Earth’s surface, amplifying climate change. Permafrost thaw will further amplify climate change. There is ongoing debate about how changes in the Arctic energy balance influence patterns of extreme weather in the mid-latitudes.
Key points.
The evidence shows that disproportionate warming in the Arctic leads to sea ice decline, land-glacier melt, permafrost thaw and wildfires and that some of these trends exert amplifying feedbacks to climate change. Arctic amplification and mid-latitude extreme weather have been shown to occur contemporaneously, but there is active debate among researchers whether the cause and effect of multiple physical processes has been robustly demonstrated.
- Observed Arctic warming anomalies have led to a decline in summer Arctic sea ice extent, up to 60% below the 1980s average (Overland et al., 2019).
- Arctic permafrost has begun to thaw in multiple regions, due to warming, with an average +6.8 cm thickening of seasonally thawed permafrost (Hayes et al., 2014).
- Greenhouse gas emissions from future permafrost thaw are projected to increase under all future emissions scenarios, forming an important amplifying feedback to climate change. The scale and pace of this feedback is uncertain (+12 GtC to +174 GtC), representing +0.05°C to +0.5°C of additional warming by 2100 (Schaefer et al., 2014; Koven et al., 2015; Schneider von Deimling et al., 2015; Schuur et al., 2015).
- Arctic wildfires have become more frequent in response to more frequent and longer periods of fire weather (Masrur et al., 2018; Box et al., 2019; Justino et al., 2021). Wildfire frequency and intensity are projected to increase in the future (Coogan et al., 2019).
- Climate models project that Arctic sea ice-free summers could occur by 2050 under a high (RCP8.5) future emissions scenario (Landrum et al., 2020).
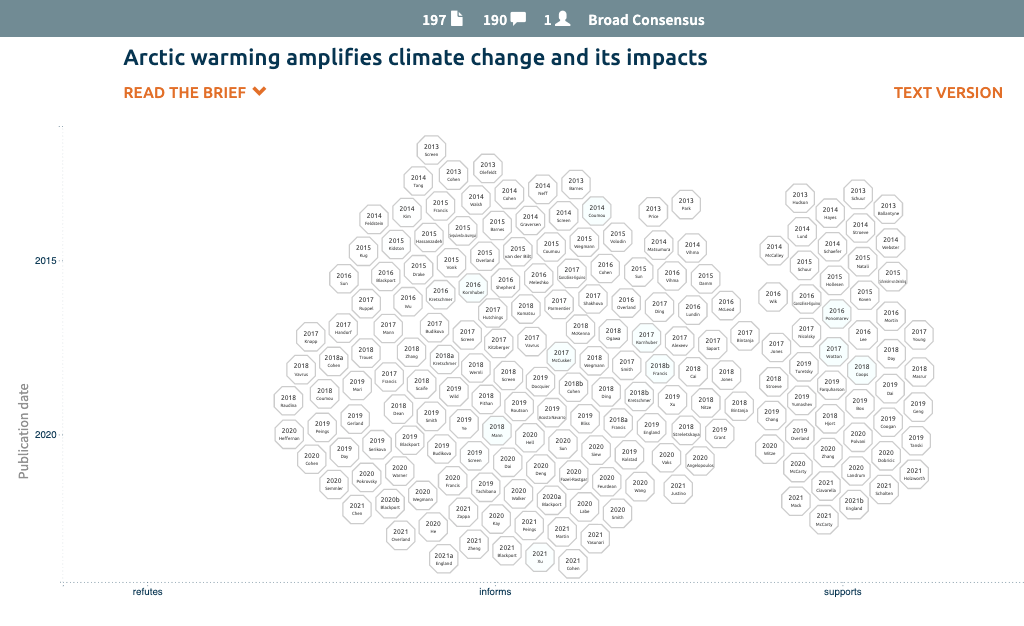
Background
Arctic amplification - the warming of the Arctic region at over twice the global average amount - has been occurring for a number of decades (Overland et al., 2016; Box et al., 2019; Cohen et al., 2020; AMAP, 2021). Numerous impacts are linked to this, including reduced sea-ice extent, more frequent summer heatwaves and wildfires, as well as permafrost thaw releasing greenhouse gases (Schuur et al., 2015; Box et al., 2019; Tanski et al., 2019; Dobricic et al., 2020).
There is a growing body of literature linking Arctic amplification and mid-latitude extreme weather (autumn/winter cold waves, snow storms and spring/summer heatwaves), via changes to large-scale atmospheric circulation (Vihma et al., 2014; Cohen et al., 2014, 2020, 2021; Coumou et al., 2018; Overland et al., 2021). While there appear to be increases in both Arctic and mid-latitude extremes over some timeframes, the causal mechanisms and their relative strength remain uncertain (Cohen et al., 2014, 2018a,b, 2020, 2021; Francis, 2018b; Blackport et al., 2020a, 2020b; Blackport & Screen, 2021). For further discussion see Box 1.
Observations
Arctic amplification of climate change
Clear evidence from observations and climate models demonstrates rapid warming of the Arctic since the late 20th century due to human-caused climate change (Francis et al., 2017; Overland et al., 2019, England et al., 2021). Record winter temperature anomalies 2015-2018 have contributed to a ~60% reduction in Arctic sea ice extent, compared to the 1980s average, and a 75% reduction in September (annual minimum) sea ice since 1979 (Overland et al., 2019).
Arctic warming has intensified the hydrological cycle, resulting in increases in precipitation, humidity, river flow, and glacier melt (Box et al., 2019). These effects have impacted Arctic ecosystems through changing the distribution of animals, plants, pollinators, nutrient supply and plant resistance to disease and impacting carbon-cycling (Box et al., 2019). The impact on evapotranspiration and clouds are less well known because of regional and seasonal variations, large data gaps in space and time and inter-model variations (Vihma et al., 2016).
Permafrost degradation
Rising Arctic temperatures and increased rainfall are leading to expanding areas of permafrost thaw, where soil, rock and ice that had been frozen for more than 2 years thaw for at least part of the year (Box et al, 2019; Overland et al., 2019). This active layer with annual freeze/thaw cycles is deepening: for example, in northeast Greenland the observed active layer depth increased, on average, by +1.6 cm per year from 1997-2010 (Lund et al., 2014), while modelling for the whole Arctic region simulated an average 6.8 cm thickening of active layer depth between 1970 and 2006 (Hayes et al., 2014). Measurements from the Canadian Arctic show rates of permafrost thaw +150% to +240% above the long-term average, representing 90 cm of ground subsidence between 2003-2016 (Farquharson et al., 2019).
Rapid degradation of permafrost by thermokarst processes (soil collapse as ice pockets thaw) or by coastal erosion, can release greenhouse gases much faster than warming alone (Schuur et al., 2015; Streletskaya et al., 2018) because metres of permafrost are disturbed over days to weeks, rather than centimetres per year during surface warming (Turetsky et al., 2019). Rising ocean temperatures, increasing energy and declining sea ice extent have the potential to destabilise submarine permafrost and gas hydrates - frozen methane and seawater (Ruppel et al. 2017). Generally, greenhouse gases released from submarine permafrost are thought to be contained within the water column (Ruppel et al. 2017), but there are localised cases of methane venting to the atmosphere (Sapart et al., 2017), so ongoing monitoring is required (Ruppel et al. 2017).
Widespread thawing of Arctic permafrost releases greenhouse gases to the atmosphere, acting as an amplifying feedback to climate change. Permafrost and peatland soils are rich stores of carbon, locked in the ground by the ice (Chaudhary et al., 2020). As permafrost thaws, the organic carbon is converted to carbon dioxide (CO2) or methane (CH4) by microbial decay, which can be emitted to the atmosphere (Schuur et al., 2015; Turetsky et al., 2019, 2020; Hopple et al., 2020). This emission of additional greenhouse gases due to initial warming is an example of a feedback that amplifies climate change (Webster et al., 2014). This is discussed in greater detail by the ScienceBrief Review about carbon-cycle ー climate feedbacks. Carbon cycle modelling for the period 1970-2006 simulates a total emission of around 3.7 GtC* to the atmosphere from thawed permafrost (Hayes et al., 2014).
Some evidence suggests that rates of carbon emissions from permafrost thaw are greater in cooler, northerly locations than in warmer, southerly locations (Raudina et al., 2018; Serikova et al., 2019; Heffernan et al., 2020). It’s possible these observations reflect localised differences in variables such as soil type, moisture content, or alternative sources of greenhouse gas emission. These observations support calls for more extensive data collection and better modelling (Schuur et al., 2015; Turetsky et al., 2019).
Wildfires
Wildfires in Arctic tundra and boreal forest ecosystems have become increasingly frequent and more intense in recent decades, predominantly due to climate change, as well as more minor factors (McCarty et al., 2021). Increases in lightning activity have been identified in the Arctic during 2010-2020 (Holzworth et al., 2021) and the fire danger index shows an increasing trend between 2000-2016, with significant upward trends in Eurasia and Siberia (Justino et al., 2021). These climate-driven trends indicate that both the frequency of natural ignition opportunities and the readiness of vegetation and organic soils to burn have increased in recent decades. The frequency of wildfires has correspondingly increased in the Arctic over the last four decades (Box et al., 2019). Examples of record-breaking wildfires in Siberia in 2019, 2020 (McCarty et al., 2020, 2021; Witze, 2020), and further fires in 2021, have occurred during heatwaves, as have a number of record-breaking fire seasons in the high latitudes of North America (Scholten et al., 2021). Satellite observations (2001-2015) indicate tundra wildfires are clustered spatially and temporally, with variability in their occurrence and intensity linked to climate variability (Masrur et al., 2018). In Canadian boreal forests, the satellite observed burned area increased +11% per year between 2006-2015 (Coops et al., 2018). Increases in summer heat and flammability of organic peat soils also mean that fires burn for longer and emit more carbon (Walker et al., 2020; Scholten et al., 2021). In particular, warm-dry periods in summer months coincide with the majority of wildfire occurrences, while warm-dry periods between late spring and mid-summer increase wildfire occurrence and intensity (Masrur et al., 2018).
Future projections
Arctic amplification of climate change
Future Arctic warming and intensification of precipitation and humidity are projected during the 21st century, resulting in continued reduction of Arctic sea ice extent (Overland et al., 2019). For example, under a medium future emissions scenario (RCP4.5), Arctic winter temperature is projected to increase +5.8±1.5°C by 2050 and +7.1±2.3°C by 2100 (Overland et al., 2019). Precipitation and humidity are expected to rise due to enhanced moisture-holding capacity of a warmer atmosphere, increased evaporation from warmer waters that are no longer covered by sea ice, as well as enhanced moisture transport from lower latitudes (Vihma et al., 2016). By 2100 under a high emissions scenario (RCP8.5) Arctic precipitation is projected to increase between +50% and +60% (Bintanja, 2019). Sea ice extent is projected to decline such that, under RCP4.5, the Arctic Ocean may be sea ice-free in late summer before the end of the 21st century (Overland et al., 2019). The Arctic may be transitioning away from a frozen state, or may already have, with surface temperature and precipitation-phase (rain or snow) emerging as a new climatic state by the mid 21st century, under RCP8.5 (Landrum et al., 2020).
Permafrost degradation
Continued future warming is projected to thaw, destabilise and erode far more permafrost, emitting large volumes of carbon to the atmosphere. Two sets of model projections suggest a 20% reduction in permafrost area in the Northern Hemisphere, by 2040, irrespective of future emissions scenario, which only impacts loss rates in the second half of the 21st century (Overland et al., 2019). Modelling simulates carbon emissions due to permafrost thaw between +12 GtC and +174 GtC, by 2100, depending on emissions and modelling scenario, which represents approximately +0.05°C to +0.5°C of additional 21st century warming (Schaefer et al., 2014; Koven et al., 2015; Schneider von Deimling et al., 2015; Schuur et al., 2015). This would require carbon emissions to be reduced by between a further -6% and -17% to limit warming to well below 2°C (González- Eguino et al., 2016). Extended modelling simulations suggest that permafrost thaw will accelerate, perhaps more than doubling emissions by 2300 (Schuur et al., 2015). In addition, CH4 emitted during permafrost thaw is modelled to represent an equivalent +10% to +40% increase in radiative forcing (warming) by 2100 (Koven et al., 2015; Schneider von Deimling et al., 2015), further reducing remaining carbon budgets.
Wildfires
Simulations project increased fire danger in some Arctic regions due to extended or more frequent periods of fire weather, greater intensity of fire weather or increases to burned area (Wotton et al., 2017; Coogan et al., 2019). Projections of future mean annual fire activity and its interannual variability vary strongly across ecosystems (Kitzberger et al., 2017; Young et al., 2017). Alaskan Arctic tundra and boreal forest edge environments are projected to experience the largest increases in fire hazard, where the 30 year fire probability is projected to increase four-fold by 2100 under RCP6.0 (Young et al., 2017). Future warming of Siberian permafrost landscapes may increase fire frequency (Ponomarov et al., 2016) in what had traditionally been a low flammability landscape. In addition to changes in heatwave, drought frequency and fire danger, the bioclimatic response of vegetation growth (fuel production) to future changes in climate is considered a major control on the future fire regime of high-latitude ecosystems (Walker et al., 2020).
This ScienceBrief Review is consistent with the IPCC Sixth Assessment Report (AR6 WG1) Chapter 10 (Cross Chapter Box 10.1, 2021), which assessed rapid Arctic warming at more than twice the global average and 25% reduction of autumn Arctic sea ice, compared to the last 40 years, as very likely* and with high confidence*, the result of human-caused greenhouse gas emissions. However, regarding links between mid-latitude extreme weather and Arctic amplification, there is low to medium confidence* in the mechanisms involved and their degree of influence, particularly due to apparent differences between observational and modelling studies.
The full Brief and references can be explored on ScienceBrief at: https://sciencebrief.org/topics/climate-change-science/arctic.
Full version in printable format is available here.
Smith, A.J.P., Smith, D.M., Cohen, J. & Jones, M.W., 2021: Arctic warming amplifies climate change and its impacts. In: Critical Issues in Climate Change Science, edited by: P. Liss, C. Le Quéré & P. Forster. https://doi.org/10.5281/zenodo.5596791.
This ScienceBrief Review was supported by the European Commission via projects 4C, VERIFY and APPLICATE (grant no. 821003, 776810 and 727862). DMS is supported by the Met Office Hadley Centre Climate Programme funded by BEIS and Defra. JC is supported by the National Science Foundation grant PLR-1901352. The authors thank J.A. Francis, J.A. Screen, and Y. Peings for comments on earlier versions of this review.
ScienceBrief is a web platform that helps make sense of peer−reviewed publications and keep up with science. It is written by scientists. ScienceBrief Reviews support transparent, continuous, and rapid reviews of current knowledge. ScienceBrief is supported by the University of East Anglia and was initiated with funding from the UK NERC International Opportunities Fund (NE/N013891/1). The ScienceBrief platform is developed by Anthony Jude De−Gol.
9. Climate change weakens carbon sinks and further amplifies climate change

- College of Engineering, Mathematics and Physical Sciences, University of Exeter, Exeter, UK.
- Laboratoire de Meteorologie Dynamique, Institut Pierre-Simon Laplace, CNRS-ENS-UPMC-X, France.
- Department of Atmospheric and Oceanic Sciences, University of Colorado, Boulder, CO, USA.
- Institute of Arctic and Alpine Research, University of Colorado, Boulder, CO, USA.
- Department of Geography, University College London, London, UK.
- School of Geography, University of Leeds, Leeds, UK.
- Center for Ecosystem Science and Society, Northern Arizona University, Flagstaff, AZ, USA.
- Department of Ecology and Evolutionary Biology, University of Colorado, Boulder, CO, USA.
- School of Environmetnal Sciences and Tyndall Centre for Climate Change Research, University of East Anglia (UEA), Norwich, UK.
Full version in printable format here.
This ScienceBrief Review is part of a collection on Critical Issues in Climate Change Science, prepared for the COP26 climate conference to be held in Glasgow (2021). Eds: Peter Liss, Corinne Le Quéré, Piers Forster.
Approach. This ScienceBrief Review examines the links between climate change (warming) and the carbon cycle where amplifying feedbacks can strengthen climate change. It synthesises findings from more than 130 peer-reviewed scientific articles gathered using ScienceBrief. The Brief and evidence can be explored at: https://sciencebrief.org/topics/carbon/future.feedbacks.
Summary. Climate change affects carbon cycle processes in a way that amplifies the increase of CO2 in the atmosphere and causes additional warming. Models suggest that climate change would act to reduce carbon sinks, leading to an additional increase in atmospheric CO2 of about 10 to 70 parts per million (ppm) per degree Celsius of global warming on decadal to century time scales. Additional carbon feedbacks from permafrost thawing and methane hydrates are uncertain but probably add no more than 30% above this range on century timescales. No runaway carbon-climate feedbacks are anticipated this century.
Key points
The evidence suggests that aspects of the carbon cycle will be impacted by climate change to weaken future carbon sinks, through multiple feedback loops that can amplify climate change.
- The size of the carbon–climate feedback is estimated to be a carbon loss to the atmosphere between 20 and 180 GtC per °C of warming (Friedlingstein, 2015), i.e. land and ocean carbon storage is reduced by warming, resulting in greater atmospheric CO2 concentration and an additional warming of up to 30 %.
- The ocean carbon-climate feedback is irreversible on timescales of decades to centuries (Schwinger & Tjiputra, 2018).
- The increasing frequency and intensity of wildfires, particularly in Arctic peatlands, have already increased CO2 emissions and may reduce future forest carbon-storage potential (Bowman et al., 2020; McCarty et al., 2021).
- Both land and ocean carbon sinks will experience amplifying feedbacks this century, reducing the carbon uptake compared to a constant climate, but both remain a carbon sink under all elevated atmospheric CO2 and warming scenarios (Canadell et al., 2021).
- The higher the emissions scenario the smaller the proportion of emissions the sinks remove, leaving a larger proportion in the atmosphere, amplifying climate change.
- Modelling suggests that feedbacks that are self-reinforcing and accelerating in size over decades to centuries - runaway feedbacks - are not projected to occur this century, under projected warming levels (Canadell et al., 2021).
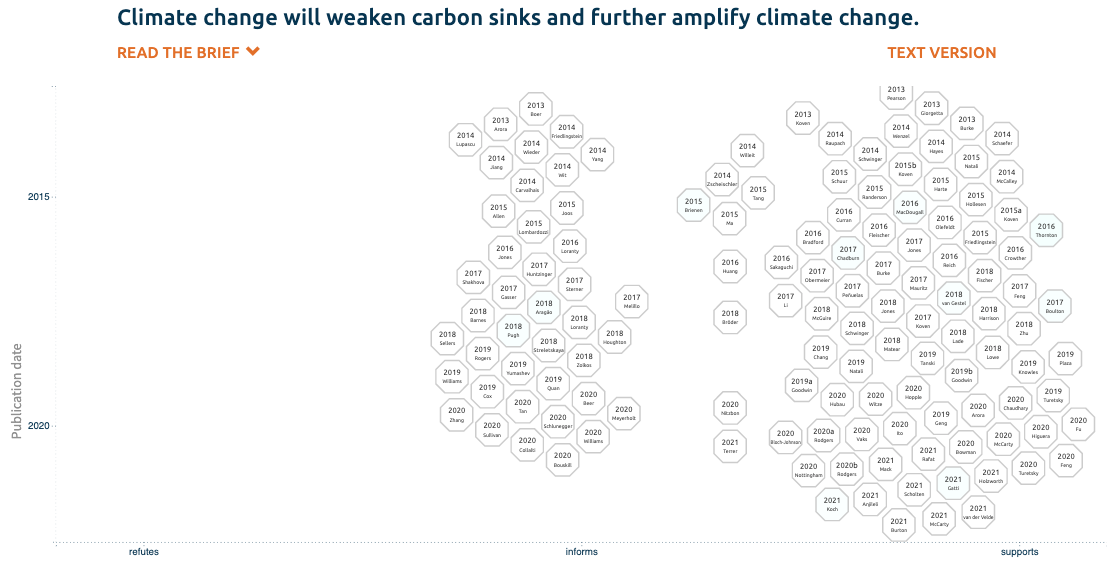
Background. Climate change modifies the rate at which different sources and sinks of carbon operate, which varies the rate of growth or decline of atmospheric carbon dioxide (CO2) concentration, amplifying or damping climate change respectively, known as ‘feedback’. In addition to the carbon–climate feedback discussed in this review, there is a carbon–CO2 concentration feedback as the land and ocean carbon sinks are primarily due to the increase in atmospheric CO2 concentration. This feedback dampens climate change. The carbon–CO2 concentration feedback is the dominant feedback in the Earth’s carbon cycle and is largely responsible for the land and ocean carbon sinks. This review focuses on the smaller carbon–climate feedback that acts in the opposite direction and enhances climate change.
The carbon–climate feedback is estimated from the change in global carbon per degree of average global warming (Friedlingstein et al., 2006, Arora et al., 2020). Its size remains moderately uncertain but evidence from models and indirect observations suggest the feedback is positive and amplifies warming. The size of the carbon–climate feedback is constrained using indirect (‘proxy’) observations, such as ice core and tree ring data (Friedlingstein, 2015) and quantified using output from a collection of Earth system model simulations (Arora et al., 2013, 2020; Williams et al., 2019).
Processes & insights from observations and models
Land feedbacks
The response of terrestrial ecosystems dominates the carbon–climate feedback, with the land contribution around three times larger than the ocean, while uncertainty estimates are an order of magnitude larger as well (Arora et al., 2020). Using idealised CO2 concentration experiments, the average value for the land carbon-climate feedback from the sixth coupled model intercomparison project (CMIP6) is -45.1 ±50.6 billion tonnes of carbon per degree (GtC °C)* (Arora et al., 2020), compared to -58.4 ±28.5 GtC per degree for CMIP5 (Arora et al., 2013). While uncertainty around the CMIP6 model mean is large, it is not symmetrical, meaning the land climate–carbon feedback is much more likely to be negative than positive. However, the overall (land plus ocean) carbon-climate feedback is likely to be positive. Modelling historic data, the land climate–carbon feedback is -28 GtC per degree warming for the 20th century, representing a loss of 25 ±10 GtC due to observed warming (Friedlingstein, 2015). Land models that include nitrogen cycle representation reduce the size of land climate–carbon feedback due to soil warming- induced enhanced nitrogen availability for photosynthesis, but also reduce model spread uncertainty (Arora et al., 2020).
The role of tropical and boreal forests is a major source of uncertainty in estimating the size of the land carbon sink. For example, Earth system models do not represent the recent saturation of the tropical forest carbon sink (Koch et al. 2021) including the reduction of the Amazon carbon sink (Hubau et al., 2020). Furthermore, the negative impacts of temperature increases on carbon uptake by photosynthesis and losses from tree respiration appear to be non-linear (Sullivan et al. 2020). More broadly, the Amazon basin as a system may be transitioning to a carbon source because of a combination of emissions from deforestation and degradation (logging and fires), plus rising temperatures and increasing drought elevating tree mortality in the southeast portion of the basin, as predicted by some Earth system models suggesting an Amazon dieback later this century (Huntingford et al., 2013; Aragão et al., 2018; Gatti et al., 2021). In the boreal zone, lengthening growing seasons and the poleward advance of the treeline may increase carbon storage (Pugh et al., 2018), though this could be offset by increases in boreal wildfire carbon emissions. The balance of these factors ultimately depends on future forest succession (McCarty et al., 2020, 2021; Mack et al., 2021).
Land carbon–climate feedback processes that amplify warming include enhanced respiration from soil microbes due to warmer temperatures, which raises atmospheric CO2 concentration (Bradford et al., 2016; Crowther et al., 2016; Feng et al., 2017; van Gestel et al., 2018; Williams et al., 2019). Short-term experiments reveal that +4°C warming of tropical soils for 2 years increased CO2 emissions by a sustained +55%, suggesting a potentially large amplifying feedback (Nottingham et al., 2020). The richness of soil organic carbon in peatlands means climate warming in these environments may generate large quantities of CO2 and methane (CH4), as demonstrated by decade-long, in situ experiments (Hopple et al., 2020). While alternative modelling suggests peatlands will remain a carbon sink under future climate change scenarios, the total peatland sink strength reduces under a high emissions scenario (Chaudhary et al., 2020).
High latitude permafrost holds around 1460-1600 GtC or about 30% of the world’s soil organic carbon, much of it stored in carbon-rich peat soils (Koven et al., 2015a; Schuur et al., 2015; Meredith et al. 2019; Rafat et al., 2021), so microbial decomposition has the potential to generate significant greenhouse gas emissions to the atmosphere, further enhancing climate change (McCalley et al., 2014; Hollesen et al., 2015; Schuur et al., 2015; Mauritz er al., 2017; Chang et al., 2019, Feng et al., 2020; Rafat et al., 2021). In Alaska, at a site undergoing rapid thaw, soil carbon degradation rates of 5.4% per year were measured over a 5 year period (Plaza et al., 2019). Model simulations for 1970-2006 estimated 11.6 GtC within thawed soil organic matter were exposed to microbial decay, releasing approximately 3.7 GtC to the atmosphere as CO2 (Hayes et al., 2014).
Overall rates of permafrost degradation are occurring much faster than traditional models of permafrost thaw suggest, increasing the rate of greenhouse gas emission from Arctic and boreal landscapes, due to the sensitivity of ice-rich permafrost to warming and disturbance. Abrupt thaw, where melting of the ice within permafrost soils leads to rapid subsidence and erosion, exposes deep organic-rich soils to microbial decay much more quickly than gradual active layer thickening. Abrupt thaw also contributes to the emission of greenhouse gases in two ways not currently captured by Earth system models (Schuur et al., 2015; Turetsky et al., 2019; Nitzbon et al., 2020). First, areas most likely to experience abrupt thaw store a disproportionate amount of soil carbon relative to areas that are likely to thaw more gradually (Olefeldt et al., 2016; Turetsky et al., 2019). Second, abrupt thaw leads to greater emissions of methane due to collapse and inundation of thawing permafrost soils (Turetsky et al., 2020). These abrupt thaw processes also occur in coastal permafrost regions, exacerbated by human-caused sea level rise and sea ice decline (Jones et al., 2018; Tanski et al., 2019). Observations indicating potentially significant concentrations of CH4 present in some permafrost landscapes in Siberia (Streletskaya et al., 2018), could suggest an additional source of greenhouse gas emission during coastal erosion, also a process that is not captured by Earth system models. Together, these observed processes could produce emissions across 2.5 million km2 of abrupt thaw that provide an equivalent climate feedback as gradual thaw emissions from the entire 18 million km2 permafrost region, under the warming projection of Representative Concentration Pathway (RCP) 8.5 (Turetsky 2020).
Observed increases to the frequency and intensity of wildfires, driven by climate change among other factors, have the potential to contribute to the carbon–climate feedback through additional CO2 emissions. Extreme and often record-breaking fires have recently been encountered in southeastern Australia (Bowman et al., 2020), western North America (Higuera et al., 2020) and Siberia (McCarty et al., 2020; Witze, 2020). The scale of these fires has resulted in substantial CO2 emissions, for example the 2019-20 Australian fires are estimated to have emitted 0.14-0.24 GtC (Bowman et al., 2020; van der Velde et al., 2021). The combination of repeat fires and drought have limited capacity for eucalyptus forests to recover and reabsorb emissions, possibly reducing future forest carbon stores (Bowman et al., 2020). In the Arctic, a new wildfire regime appears to be emerging, with climate change causing longer and more intense fire weather (McCarty et al., 2020; Scholten et al., 2021) and more frequent lightning ignitions (McCarty et al., 2021). The occurrence of overwintering or zombie fires (McCarty et al., 2020; Scholten et al., 2021) mean wildfires are not dependent on ignition sources and are burning deeper into peat soils, which are extremely rich in organic carbon, further increasing CO2 emissions (McCarty et al., 2020, 2021; Scholten et al., 2021). Landscape and vegetation changes mean previously fire-resistant landscapes are burning (McCarty et al., 2020, 2021). However, following wildfires, former boreal black spruce forests are regenerating with a mixture of fast-growing, deciduous broadleaf trees and conifers, which can increase subsequent forest carbon-storage by a factor of 5, offsetting some fire emissions (Mack et al., 2021) and limiting the feedback effect. On the other hand, more severe burning in peatlands, particularly those impacted by drought or drainage, is likely to result in much greater emissions than have been documented to date (Turetsky et al. 2011).
Ocean feedbacks
Warming of the ocean creates an amplifying feedback that reduces the rate of CO2 uptake from the atmosphere, contributing to higher atmospheric CO2 concentration and further warming. Changes in the fluxes of momentum (wind), heat, and freshwater driven by anthropogenic climate change may inhibit ocean CO2 uptake by reducing the solubility of carbon in a warmer ocean; affecting change in the biological drawdown of carbon; and reducing ventilation of the ocean interior by stratifying the surface ocean (Williams et al., 2019). In addition to reduced CO2 solubility, the re-emergence of anthropogenic carbon in shallow overturning circulation cells in the subtropical oceans, further amplifies, though only slightly, the solubility feedback and further reduces net CO2 uptake by the ocean (Rodgers et al., 2020b). Utilising idealised CO2 concentration experiments, the average value for the ocean carbon–climate feedback from CMIP6 is -17.2 ±5.0 GtC °C (Arora et al., 2020), compared to -7.8 ±2.9 GtC °C for CMIP5 (Arora et al., 2013). Modelling historic data between 1750-2011, the ocean feedback is estimated to be -8 ±3 GtC °C, representing a loss of around 7 ±4 GtC, given a historical warming of 0.85 ±0.2 °C (Friedlingstein, 2015).
Subsea permafrost carbon stores are small potential sources of greenhouse gas emission to the atmosphere, if they slowly destabilise with future warming (Schuur et al., 2015; Shakhova et al., 2017). The Arctic seabed accumulates methane gas bubbles leaking from natural biogenic and thermogenic sources; including methane clathrates, a frozen matrix of ice and methane kept stable at subsea depths by low temperatures and high pressures; and eroded permafrost sediment transported from coastlines and Arctic rivers (Schuur et al., 2015). Estimated CH4 emission to the atmosphere, from both subsurface escape and permafrost thaw, ranges from at around 3-17 Tg* per year for the whole East Siberian Arctic Shelf (Thornton et al., 2016; Shakhova et al., 2017), but these emissions could rise with ongoing warming of Arctic ocean bottom waters.
Future projections
Land feedbacks
Throughout this century, the land carbon sink is projected to continue absorbing CO2 under all emissions scenarios and, despite considerable uncertainty, is projected to decrease by 2100 (Randerson et al., 2015). Future scenario modelling suggests Amazon dieback may reduce forest area by at least 25%, due to the effects of increased temperature and dry-season length overwhelming any gain due to the CO2 fertilisation effect (Boulton et al., 2017). Experimental results (Terrer et al., 2021) indicate that as CO2 concentration rises and plant biomass increases, soil organic carbon is reduced as plants take up more nutrients. In permafrost landscapes, short-term experiments (Li et al., 2017) suggest that warming initially enhances CO2 uptake by plants during the early part of the growing season but this weakens or disappears later in the growing season. In boreal and temperate forests, long-term experiments (Reich et al., 2016) indicate additional warming will increase the CO2 flux due to enhanced plant respiration, however plants acclimatise to warming, which limits the size of this increase.
Permafrost thaw is modelled to emit between 12 GtC and 174 GtC by 2100 depending on emissions and modelling scenario (Koven et al., 2015a; Schuur et al., 2015; MacDougall & Knutti, 2016). In extended modelling to 2300, under a high emissions scenario, around half of permafrost thaw is projected to occur before 2100 (Kovan et al., 2015a), with peak carbon emission and loss of carbon storage occurring after 2100 (MacDougall & Knutti, 2016; McGuire et al., 2018). Expert judgement presented by Schuur et al. (2015) predicted between 5%-15% (66-237 GtC) of stored permafrost carbon could be degraded and emitted to the atmosphere as greenhouse gases by 2100. Although, if models were to account for abrupt thaw (thermokarst) processes more accurately (Turetsky et al., 2019), the area of permafrost thaw within model projections could increase by 2100, between four-fold and twelve-fold for medium (RCP4.5) and high (RCP8.5) emissions scenarios, respectively (Nitzbon et al., 2020). This may also alter whether peak carbon emissions occur prior to, or after, 2100. In terms of projected future global mean warming, thawing permafrost may result in an additional 0.05°C to 0.5°C, by 2100 (Schaefer et al., 2014; Schuur et al., 2015).
Future emissions from wildfires are expected to increasingly contribute to the carbon–climate feedback by increasing emissions and, in some regions, limiting forest carbon-storage. Biomass burning is projected to increase under climate change in some regions and could contribute to a centennial-scale feedback of -6.5 ±3.4 ppm CO2 per degree of land surface warming (Harrison et al., 2018). In South America, future warming of +4°C is projected to result in a -30% reduction in forest-stored carbon, compared to just a -7% reduction if warming is limited to +1.5°C (Burton et al., 2021).
Ocean feedbacks
The future ocean carbon sink is projected to weaken (stronger ocean feedback) under a high emissions scenario, by over 20%, amplifying further warming. Future projections suggest that with rising ocean heat content (Randerson et al., 2015) and associated ventilation and circulation changes, the ocean carbon–climate feedback will be amplified by 2100, weakening the ocean carbon sink (Randerson et al., 2015). In an extended single-model simulation to 2300, under a high future emissions scenario (RCP8.5 and its extension), the ocean carbon sink is projected to weaken by more than 20% or 330 GtC (Randerson et al., 2015).
The ocean carbon–climate feedback is irreversible on timescales of decades to centuries (Schwinger & Tjiputra, 2018). A modelling study that simulates a future hypothetical scenario where CO2 is removed from the atmosphere (so-called “negative emissions”) indicates that the ocean carbon–climate feedback continues to restrict oceanic carbon uptake and produces anomalously high (+52 ppm) atmospheric CO2 concentrations, compared to a simulation without climate change (Schwinger & Tjiputra, 2018).
This ScienceBrief Review is consistent with the IPCC Sixth Assessment Report (AR6 WG1) Chapter 5, which concluded that both the land (medium confidence) and ocean (high confidence) carbon sinks will experience amplifying feedbacks, reducing the carbon uptake compared to a simulated constant climate. Under all scenarios, the land and ocean continue to act as a carbon sink throughout this century, but under higher emissions, the land and ocean sinks take up a smaller proportion of emissions, leaving a larger proportion in the atmosphere, amplifying climate change.
The full Brief and references can be explored on ScienceBrief at: https://sciencebrief.org/topics/carbon/future.feedbacks.
Full version in printable format here.
Friedlingstein, P., Lovenduski, N.S., Lewis, S.L., Schuur, E.A.G., Turetsky, M.R., and Smith, A.J.P., 2021: Climate change weakens carbon sinks and further amplifies climate change. In: Critical Issues in Climate Change Science, edited by: P. Liss, C. Le Quéré & P. Forster. https://doi.org/10.5281/zenodo.5596739.
This ScienceBrief Review was supported by the European Commission via projects 4C and VERIFY (grant no. 821003 and 776810). The authors thank C.D. Jones for reviewing an earlier version of this review.
ScienceBrief is a web platform that helps make sense of peer−reviewed publications and keep up with science. It is written by scientists. ScienceBrief Reviews support transparent, continuous, and rapid reviews of current knowledge. ScienceBrief is supported by the University of East Anglia and was initiated with funding from the UK NERC International Opportunities Fund (NE/N013891/1). The ScienceBrief platform is developed by Anthony Jude De−Gol.
10. Independent expert advisory bodies facilitate ambitious climate policy responses
- School of Environmental Sciences, University of East Anglia (UEA), UK.
- Centre for Climate Change and Social Transformations (CAST), University of East Anglia (UEA), UK.
- Tyndall Centre for Climate Change Research, University of East Anglia (UEA), UK.
Full version in pdf format available here.
This ScienceBrief Review is part of a collection on Critical Issues in Climate Change Science, prepared for the COP26 climate conference to be held in Glasgow (2021). Eds: Corinne Le Quéré, Peter Liss, Piers Forster.
Approach. This ScienceBrief Review examines emerging evidence of the impact that independent expert advisory bodies have had on the design and delivery of ambitious climate policy responses. It synthesises findings from more than 20 peer−reviewed scientific articles gathered using ScienceBrief. The Brief and evidence can be viewed at: sciencebrief.org/topics/climate-change-science/independent-advisory-bodies.
Summary. Many countries have established independent expert advisory bodies as part of their national policy strategies to tackle climate change. Such bodies provide evidence to inform government policy in pursuit of long-term climate objectives. They monitor progress and help focus climate change debates on key issues. These bodies are emerging as strong assets that can help governments raise ambition and deliver climate objectives in practice. They can increase public support for climate action and, by enabling long-term strategic vision, encourage private investments. More evidence is needed to assess the extent to which they are effective in supporting the delivery of climate objectives.
Key points
- More than 40 countries have established climate advisory bodies to assist in the delivery of climate objectives, varying in expertise and independence.
- Emerging studies suggest such bodies are most impactful when they are independent from government, composed of members appointed for their expertise, small, and well-resourced.
- Recent studies find that these bodies can enhance climate responses by lending credibility to climate policies, strengthening public trust, and advising on feasible and ambitious policy action.
- Limited evidence exists to assess the true effectiveness of advisory bodies in terms of the uptake of their advice by governments and their support of the design and delivery of ambitious climate targets.
Background
Over 100 countries have stated their intention to implement net-zero greenhouse gas emissions commitments to tackle climate change; the big question is how they will achieve them. Governments are reliant on expert advice to inform existing and new climate policies (Christensen and Velarde, 2019). Over the last decade climate change advisory bodies have proliferated. They are now in place in more than 40 countries, varying in expertise and independence (Averchenkova et al., 2021), and are a central feature of national climate responses (Abraham-Dukuma et al., 2020). The first independent expert climate advisory body was the UK Climate Change Committee (CCC), established under the 2008 UK Climate Change Act, with similar bodies now in place in at least Austria (2011), Iceland (2012), Denmark (2014), Finland (2015), Ireland (2015), Norway (2017), Sweden (2017), France (2018) and New Zealand (2019).
The composition and remit of advisory bodies varies by country. For example, bodies in Austria, Denmark and Finland are only tasked with providing advice rather than reviewing government progress (Nash and Steurer, 2019). Similar to the UK, the Irish Climate Change Advisory Council undertakes annual and periodic reviews of government progress, whilst the Swedish Climate Policy Council submits an annual progress report, and interim reports, on mitigation planning to the government. Climate governance differs in Denmark, which pursues credible commitment through political party agreements and not the ‘legislate and delegate’ approach of the UK, and therefore the Danish Climate Advisory Council was thought to have had little influence on policy (Lockwood, 2021). The majority of advisory bodies created by national climate legislation focus primarily on mitigation (Muinzer, 2019); the UK CCC is notable in that it also has adaptation as a central focus.
Advisory bodies that are independent from short term electoral politics are more likely to be effective and influence policy (Averchenkova 2020a; Averchenkova et al., 2021). For example, there were concerns about national advisory bodies in Japan because they were close to government and lobbyists and lacked policy analysis expertise, hence they were not independent and failed to gain the public’s trust (Crowley and Head, 2017). By contrast the UK CCC is widely considered to be “a good institutional model for independent climate advisory bodies” (Nash and Steurer, 2019). Because of its independent analysis and scrutiny the UK CCC is widely trusted by policymakers of all parties (Averchenkova et al., 2018). One study suggests that for climate change governance to be effective an independent and multidisciplinary expert advisory body “will play a key role” (Abraham-Dukuma et al., 2020).
Advisory bodies need to be small enough to operate effectively (Göpfert et al., 2019). For example Averchenkova (2020a) recommends that an EU climate advisory body should have five to 15 members as this aligns with the size of climate advisory bodies in Member States.
Independent expert advisory bodies have impacted climate policies in different ways:
- They support a long-term perspective in climate policies. Advisory bodies can help to achieve policy durability (Jordan and Moore, 2020) which provides regulatory certainty for investments and increases the credibility of government action (Averchenkova, 2020a). For example the creation of the UK CCC signals the UK Government’s credible commitment to a low-carbon transition; this creates a stable, predictable policy environment that can encourage investment (Lockwood 2013, 2021). The UK CCC advises the government on the level that it should set its carbon budgets 12 years in advance. This helps avoid short-term political cycles driving decision-making. Establishing an expert climate change advisory body won’t instantly improve a country’s performance but it can improve mitigation and adaptation progress in the longer-term (Abraham-Dukuma et al., 2020). One study suggests that countries with climate legislation and expert institutions, such as advisory bodies, might be more able to effectively deliver climate adaptation actions than countries without them (Massey and Huitema, 2013).
- They provide regular, mostly annual, assessments of progress with a duty to respond from governments, which maintains momentum in climate action (Nash and Steurer, 2019). For example, the UK CCC is mandated to annually review the UK’s performance against its long-term climate targets which makes it difficult for the government to backslide and creates greater policy ambition (Farmer et al., 2019).
- They can engage the public and strengthen public trust. Stakeholder engagement and facilitation of public debate is a formal part of the remit of independent advisory bodies in some countries. For example, the Danish Council on Climate Change is mandated to create a Climate Dialogue forum (Weaver et al., 2019). Interviewed climate change policy experts agreed that climate change advisory bodies are “essential” for strengthening public trust, fostering political support for climate action and increasing the legitimacy and accountability of policymaking (Averchenkova 2020a: 1); these factors are all considered “necessary” for a successful net-zero transition in Europe (ibid). During early stages of the policymaking process advisory bodies can define the policy problem through public engagement and debate (Hoppe et al., 2013), for example expert advisory commissions in Norway play a vital role in policy formulation (Christensen and Holst, 2017).
- They can provide actionable recommendations. To have impact, climate advisory bodies must present findings and reports that can translate into actionable policies (Abraham-Dukuma et al., 2020). This is achieved by providing clear, objective, independent advice that has been assessed for its political feasibility and meets the government’s needs (Salacuse, 2018; Sager et al., 2020). The success of advisory bodies depends on whether their recommendations align with the needs of policymakers at the time (Salacuse, 2018). For expert advice to influence environmental policy-making it can utilize ‘windows of opportunity’ such as increased public support for government action (Rose et al., 2020). For example, an empirical analysis of the Royal Commission on Environmental Pollution found its advice was more likely to be implemented by the UK government if it was provided during a peak of public support for government action (Owens, 2015).
Advice that has been produced in consultation with policymakers ensures its relevance to the policymaking process (Crowley and Head, 2017; Jones et al., 2016; Groux et al., 2018). For example, in New Zealand the co-production of advice by an advisory body, scientists, policy planners and the community enabled collective decision-making and ensured that the advice provided to policymakers was policy-usable and legitimate within the current political context (Duncan et al., 2020). However, a challenge to be navigated is that the ability and willingness of political actors to support climate policy monitoring activities can be limited, for example in the EU (Schoenefeld et al., 2018).
Reinecke et al., (2013) found that climate advisory bodies in Germany, the UK, the Netherlands and Denmark enhance the saliency, credibility and legitimacy of their advice by:
- being comprised of expert members;
- consulting non-scientific actors in their deliberations;
- adhering to scientific standards of analysis; and,
- disclosing uncertainties.
Rather than through formal powers, the UK CCC’s influence is based on reputation and authority (Lockwood, 2013). It has had several concrete impacts on national climate policy (see Box 1).
Conclusion
An emerging literature is beginning to evidence the influence that advisory bodies can have on national climate policy. This influence is achieved through transparent mandated reporting procedures, contributions to evidence-based policymaking, publicly reporting shortfalls in government progress, and advising on feasible climate action. Climate Change Acts that establish dedicated institutions, such as expert advisory bodies, serve to institutionalise climate change into policymaking; this makes it difficult to take climate change off the political agenda (Nash and Steurer, 2020). The composition and remit of climate advisory bodies is important, with the most impactful bodies so far being independent, expert, small and well-resourced. Apart from the case studies mentioned there is little evidence yet of the depth of impact that advisory bodies can have on enhancing climate actions; time, further analysis and more research are needed.
The full Brief and peer reviewed references can be explored at sciencebrief.org/topics/climate-change-science/independent-advisory-bodies.
Full version in pdf format available here.
- Averchenkova, A., Fankhauser, S. and Finnegan, J. J. (2018) ‘The role of independent bodies in climate governance: the UK’s Committee on Climate Change’, Grantham Research Institute on Climate Change and the Environment.
- Averchenkova, A. (2020a) The design of an independent expert advisory mechanism under the European Climate Law: What are the options? Grantham Research Institute on Climate Change and the Environment.
- Owens, S. (2015) Knowledge, policy, and expertise: The UK Royal Commission on Environmental Pollution 1970-2011. Oxford University Press.
11. Acknowledgments
The collection 'Critical Issues in Climate Change Science' was written by international teams of experts who generously contributed to the writing of these ScienceBrief Reviews, in order to raise awareness of the issues discussed.
It was edited by Corinne Le Quéré, Peter Liss, and Piers Forster, and directed by Adam Smith. Production and dissemination of these reports was aided by Anthony Jude De-Gol, Renee Karunungan, Asher Minns, Cat Bartman and Laura Potts of UEA.
We thank Nathan Bindoff, Andy Haines, Ben Santer, Thomas Stocker and Bob Watson who provided advice and feedback in their role as members of the Advisory Board of the 'Critical Issues in Climate Change Science' topic at ScienceBrief.org.
The ScienceBrief platform is developed by Anthony Jude De-Gol and hosted by Dave Cutting.
The collection is available as a pdf to download or print here.
Critical Issues in Climate Change Science (2021), edited by: C. Le Quéré, P. Liss & P. Forster. https://doi.org/10.5281/zenodo.5761743. Individual ScienceBrief Reviews should be cited separately, as listed at the end of each review.
Copyright: material may be reproduced with citation of original source.